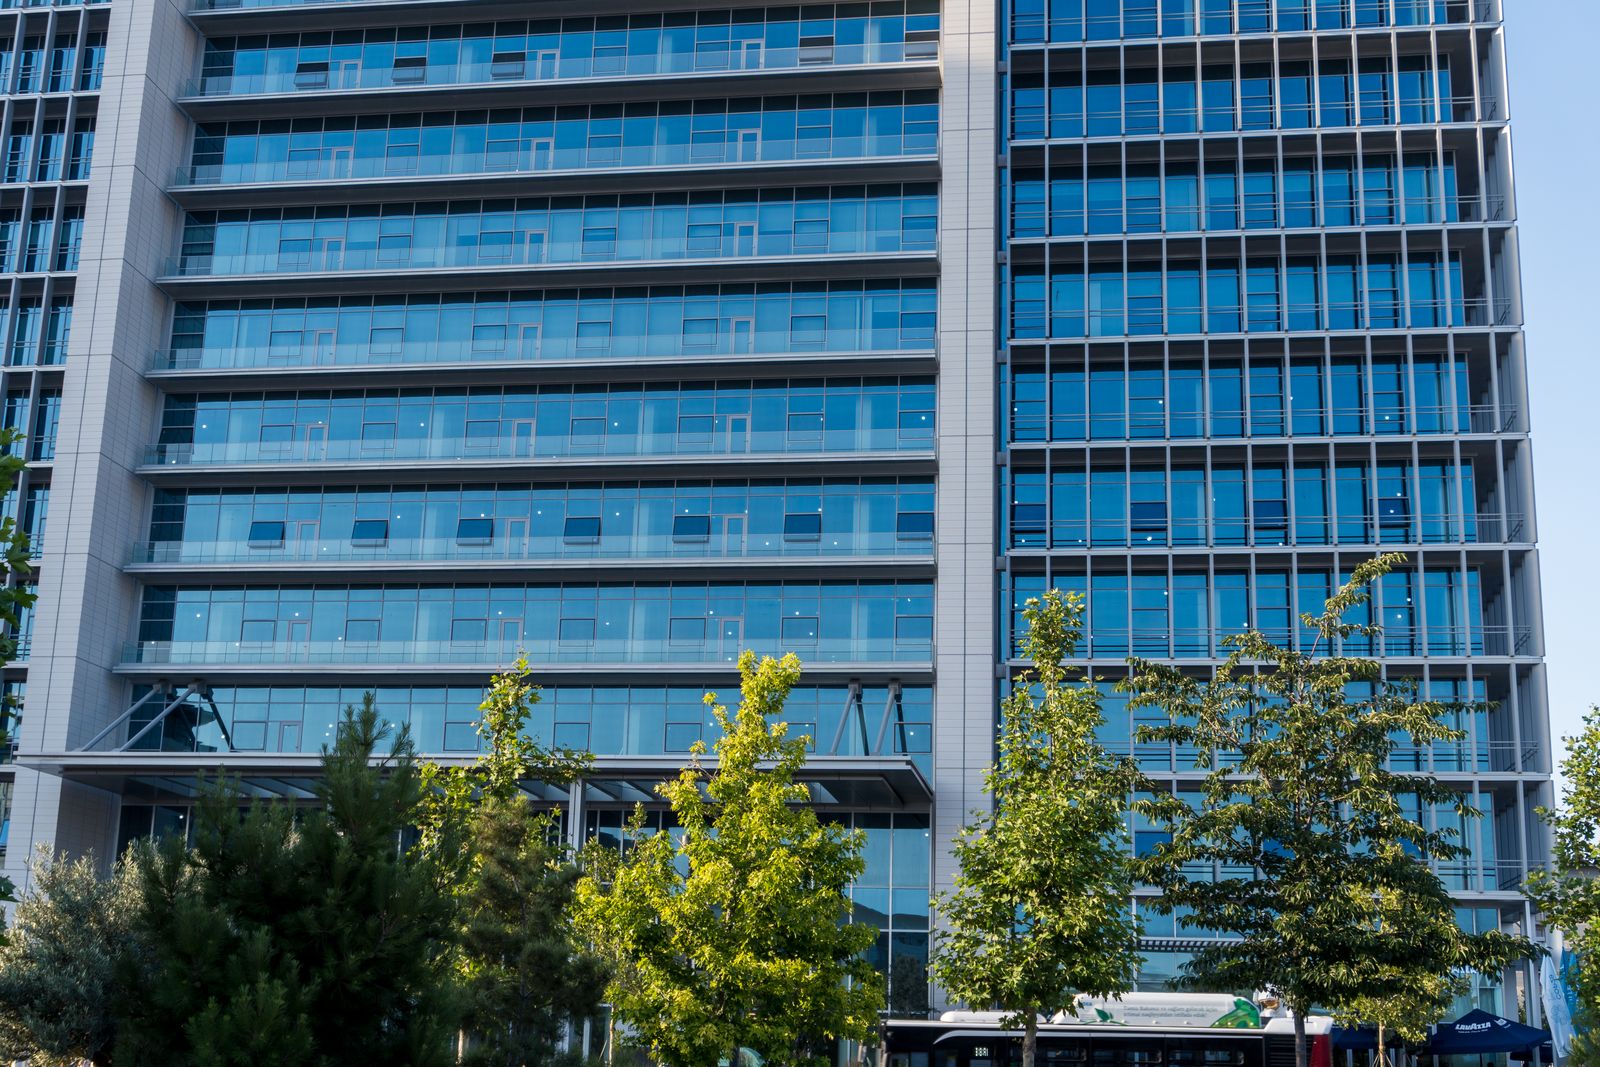
01Office
- Vacancy
- 19.6%
- Sublease
- 410,000 SF
- Absorption
- -84,000 SF
- Under construction
- 0 SF
- Asking rate
- $16.20
- Year on year
- -0.9%
Quoted nnn.
Twin Cities office, industrial, retail and investment. Demonstration site with sample content.
Downtown towers, North Loop creative space and suburban campuses, leased on your side of the table.

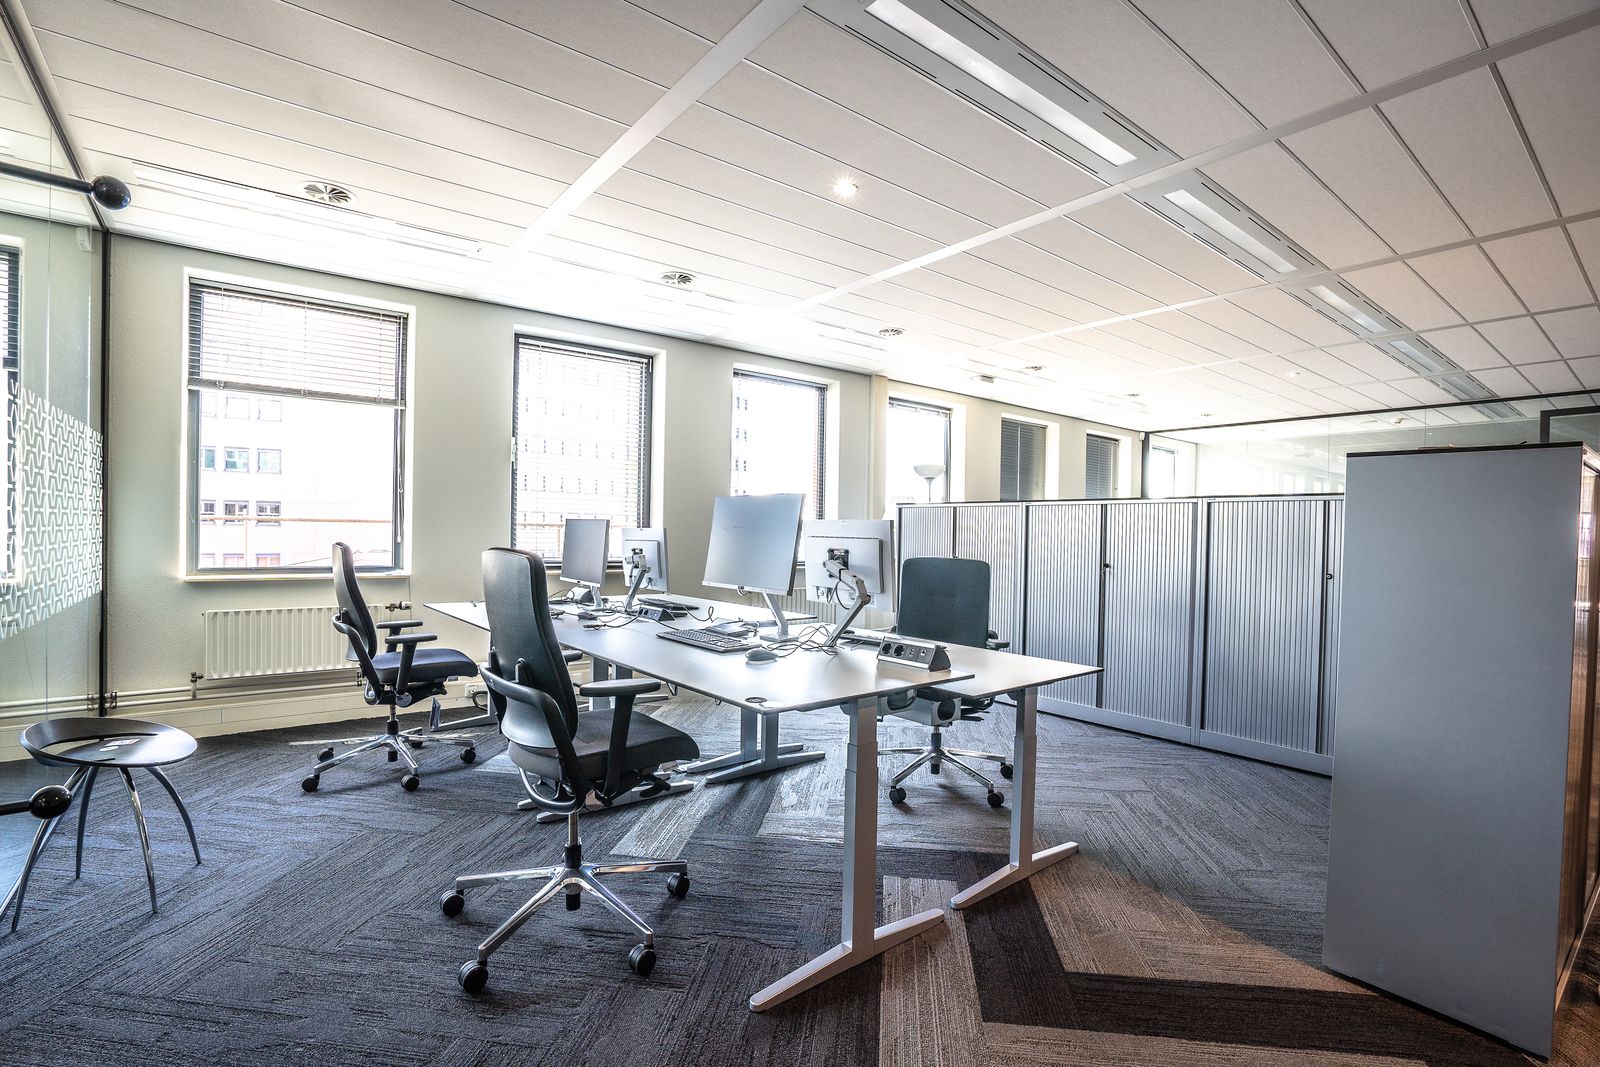
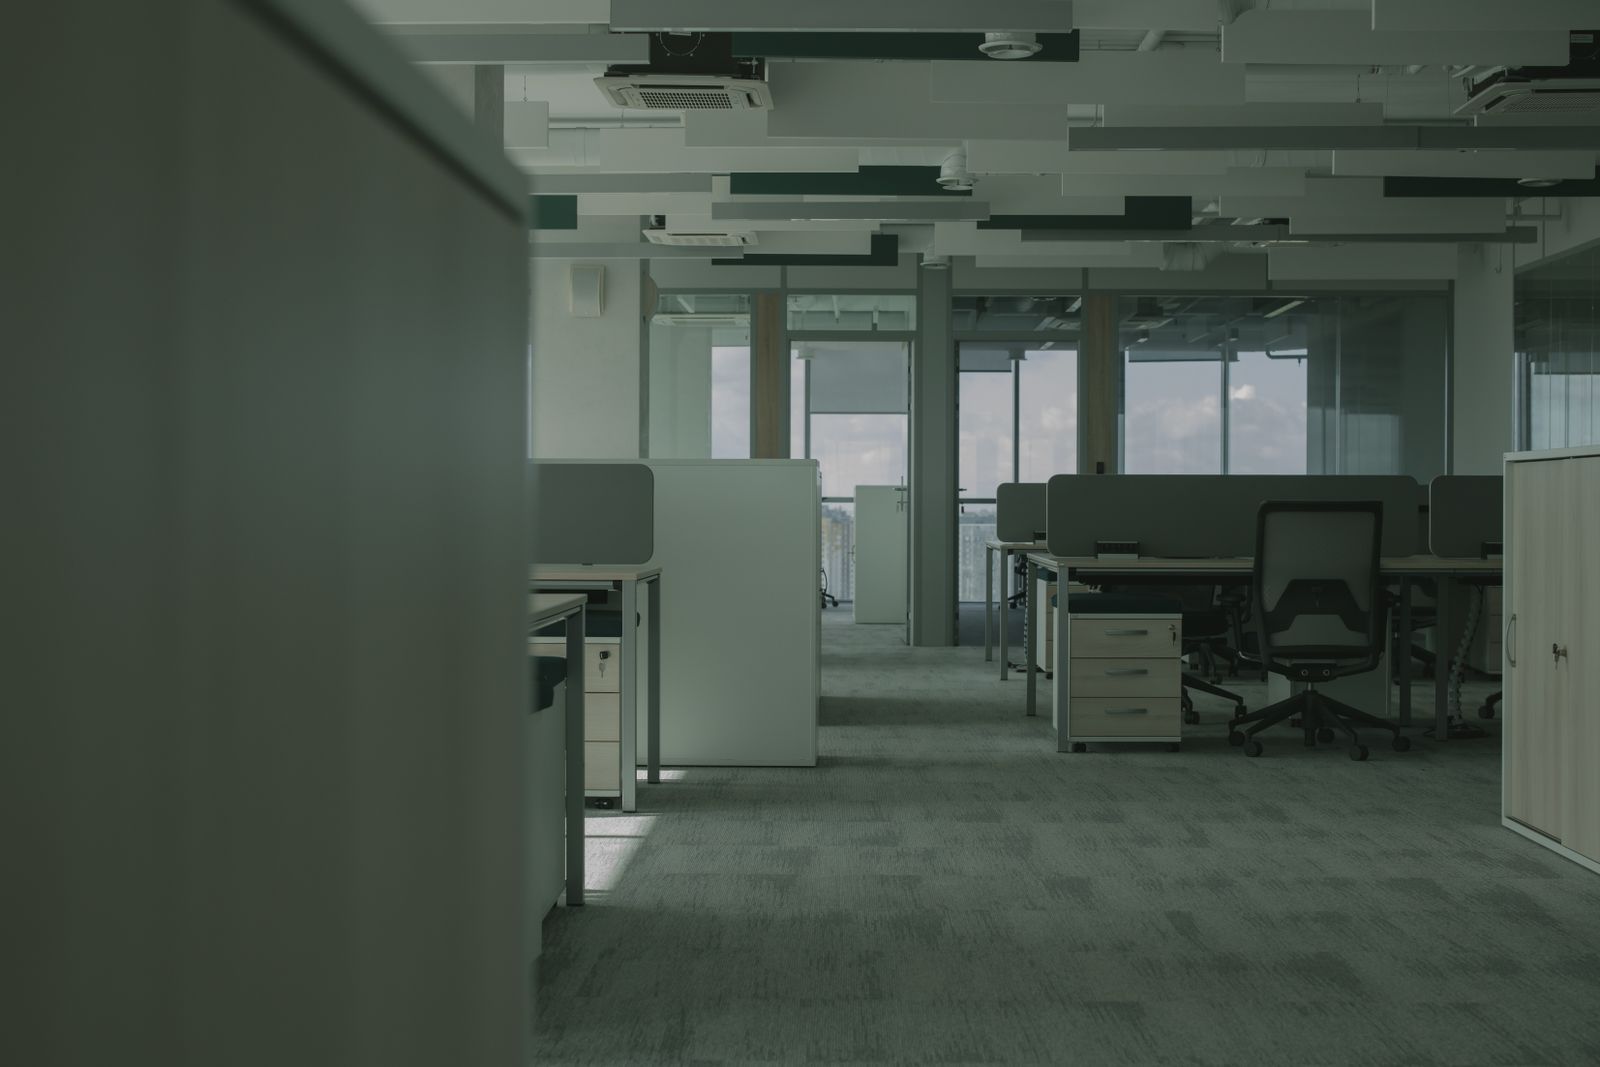

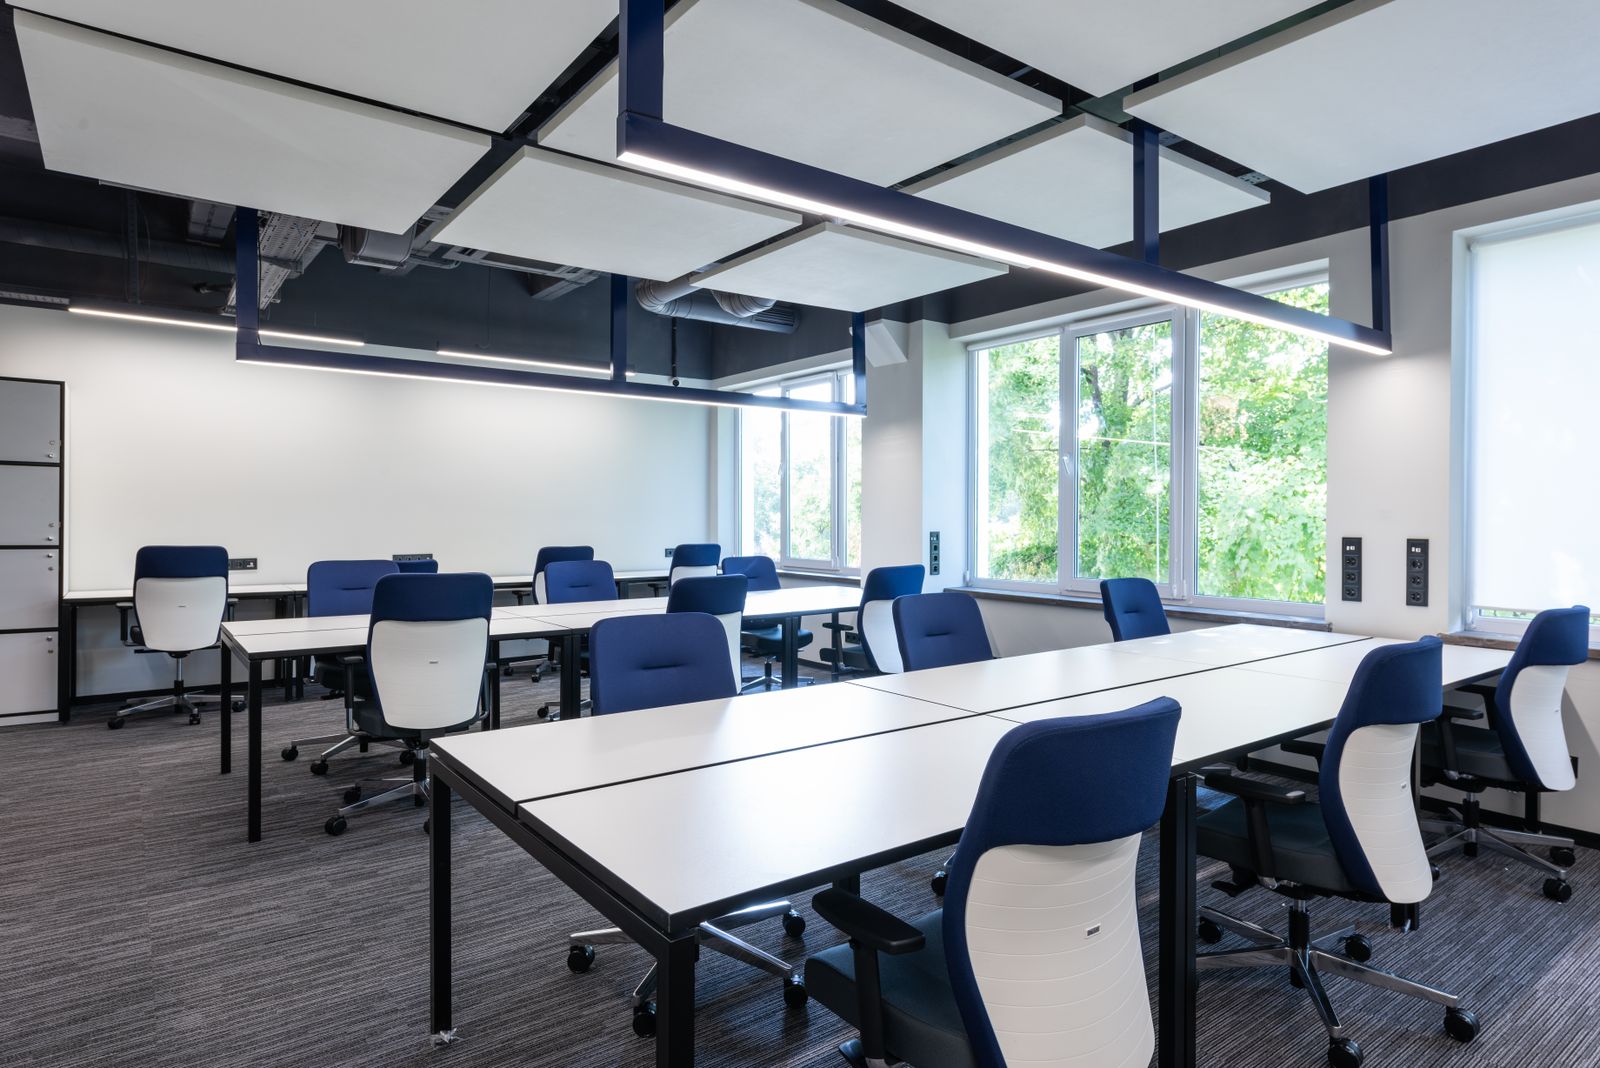
Minneapolis CBD
Distribution, light manufacturing and crossdock buildings across the airport south and northwest corridors.
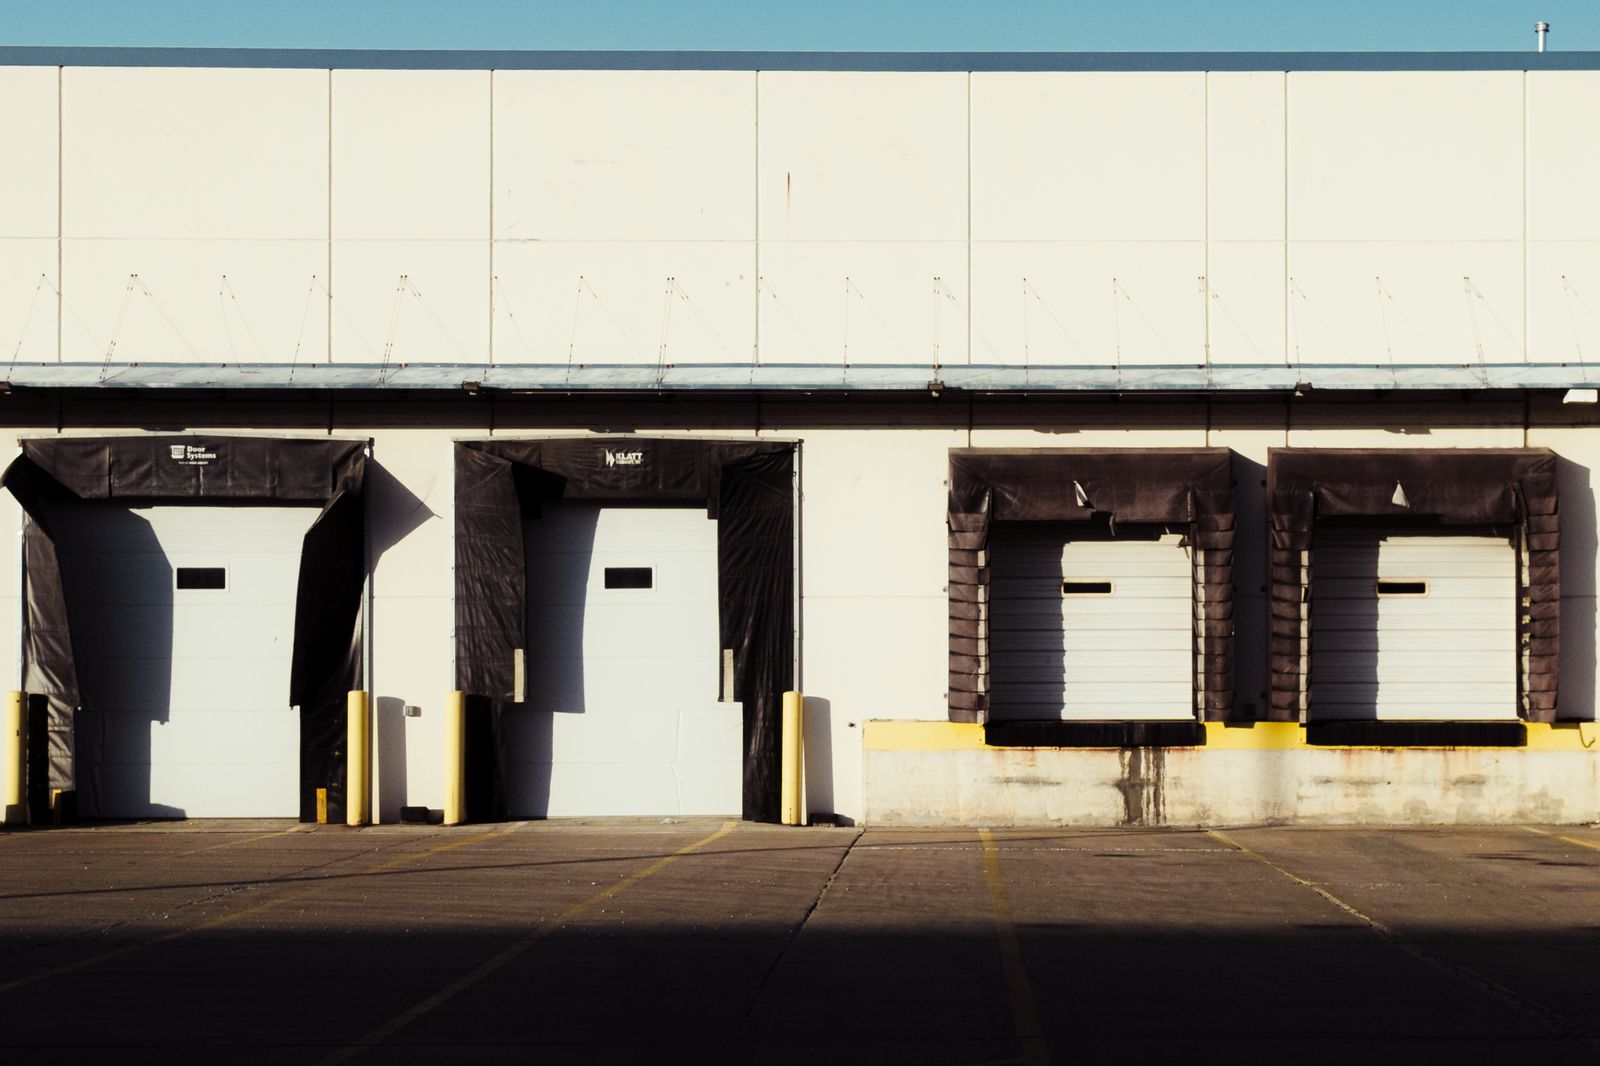
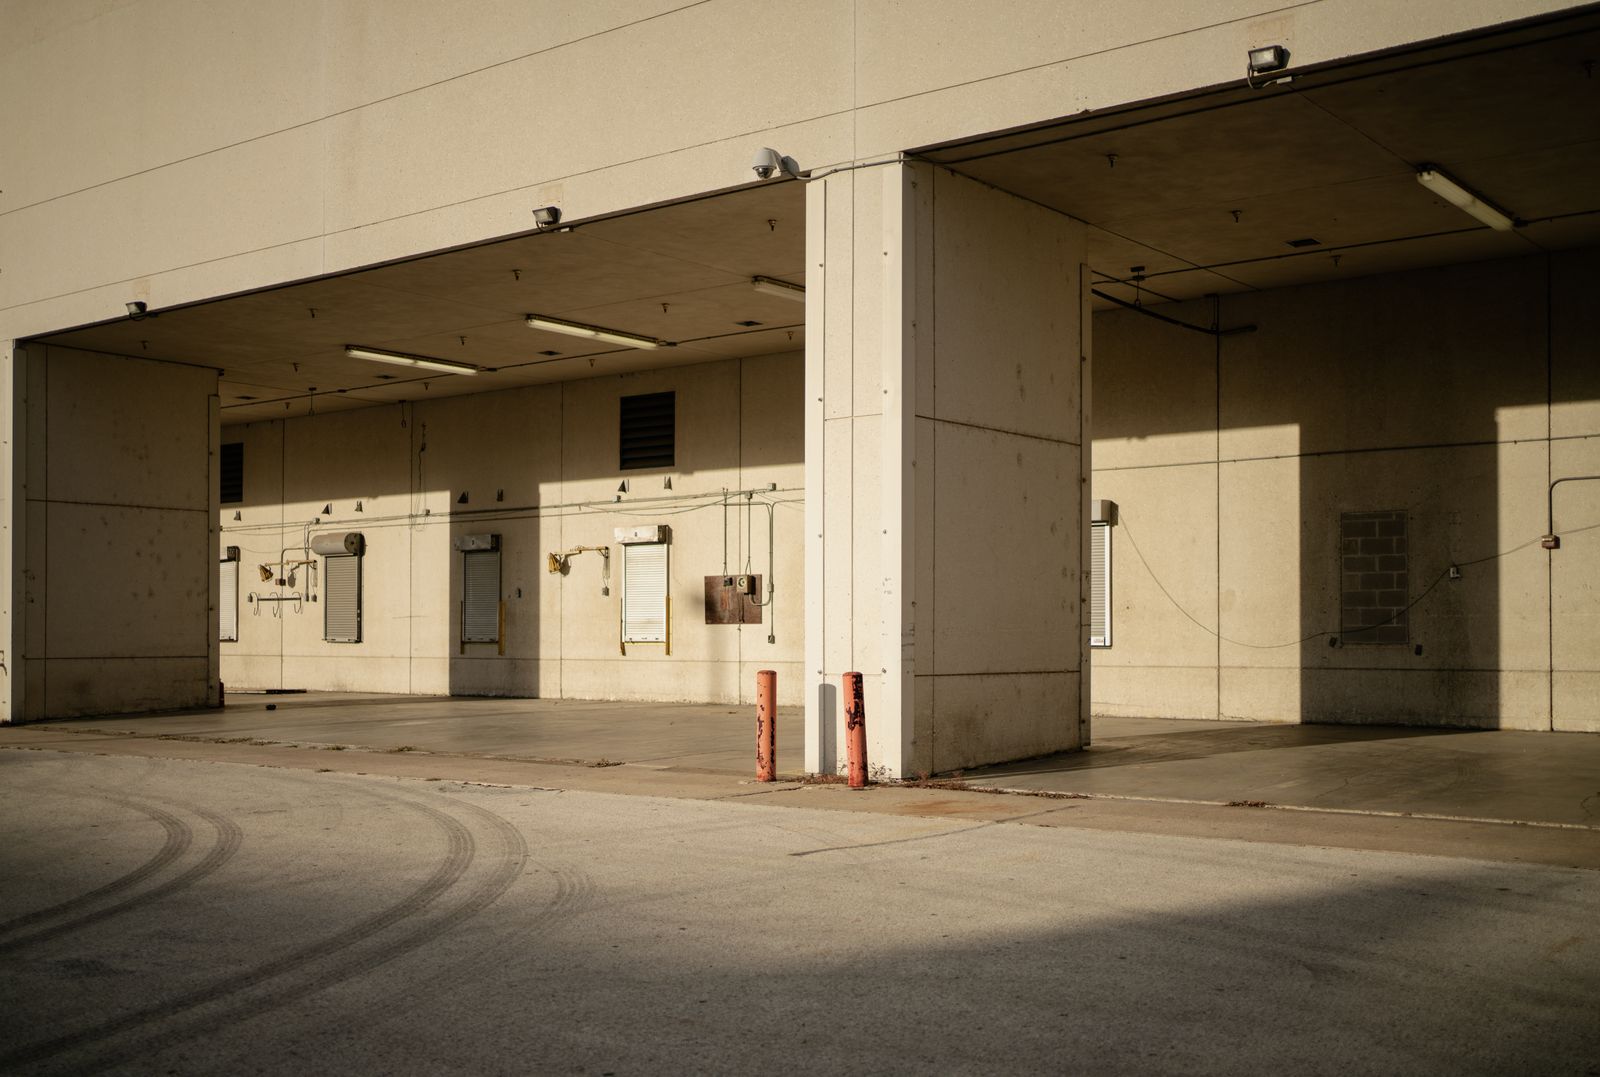
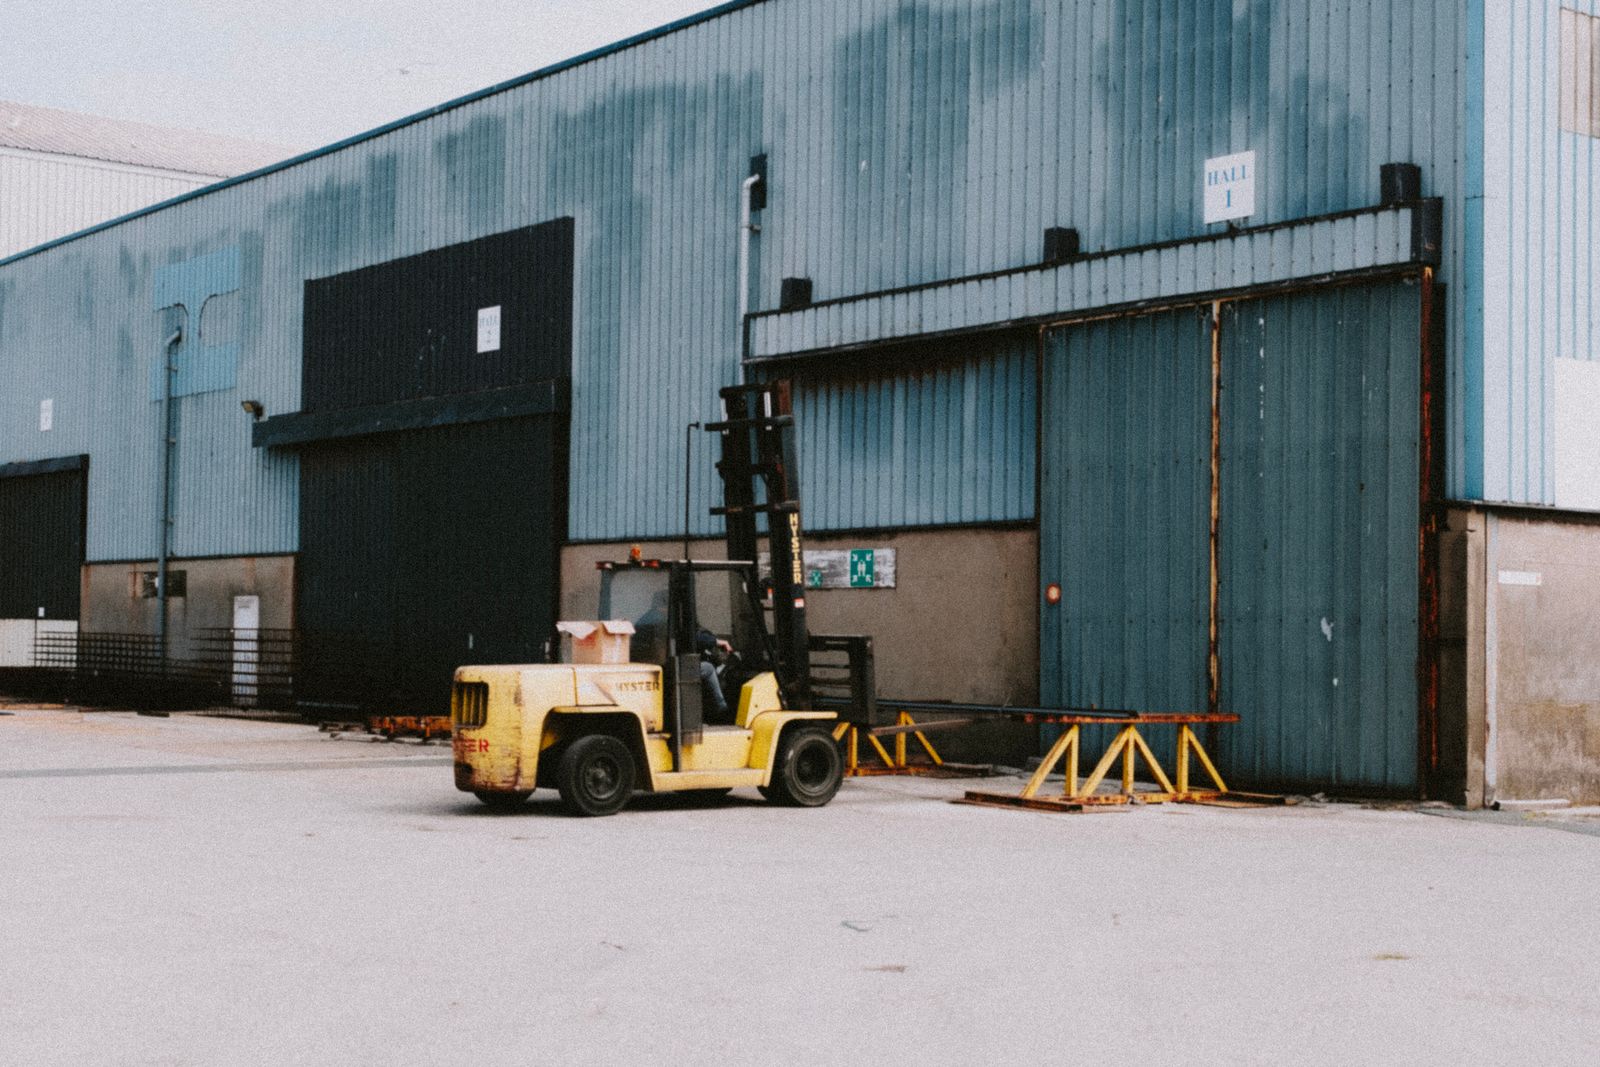
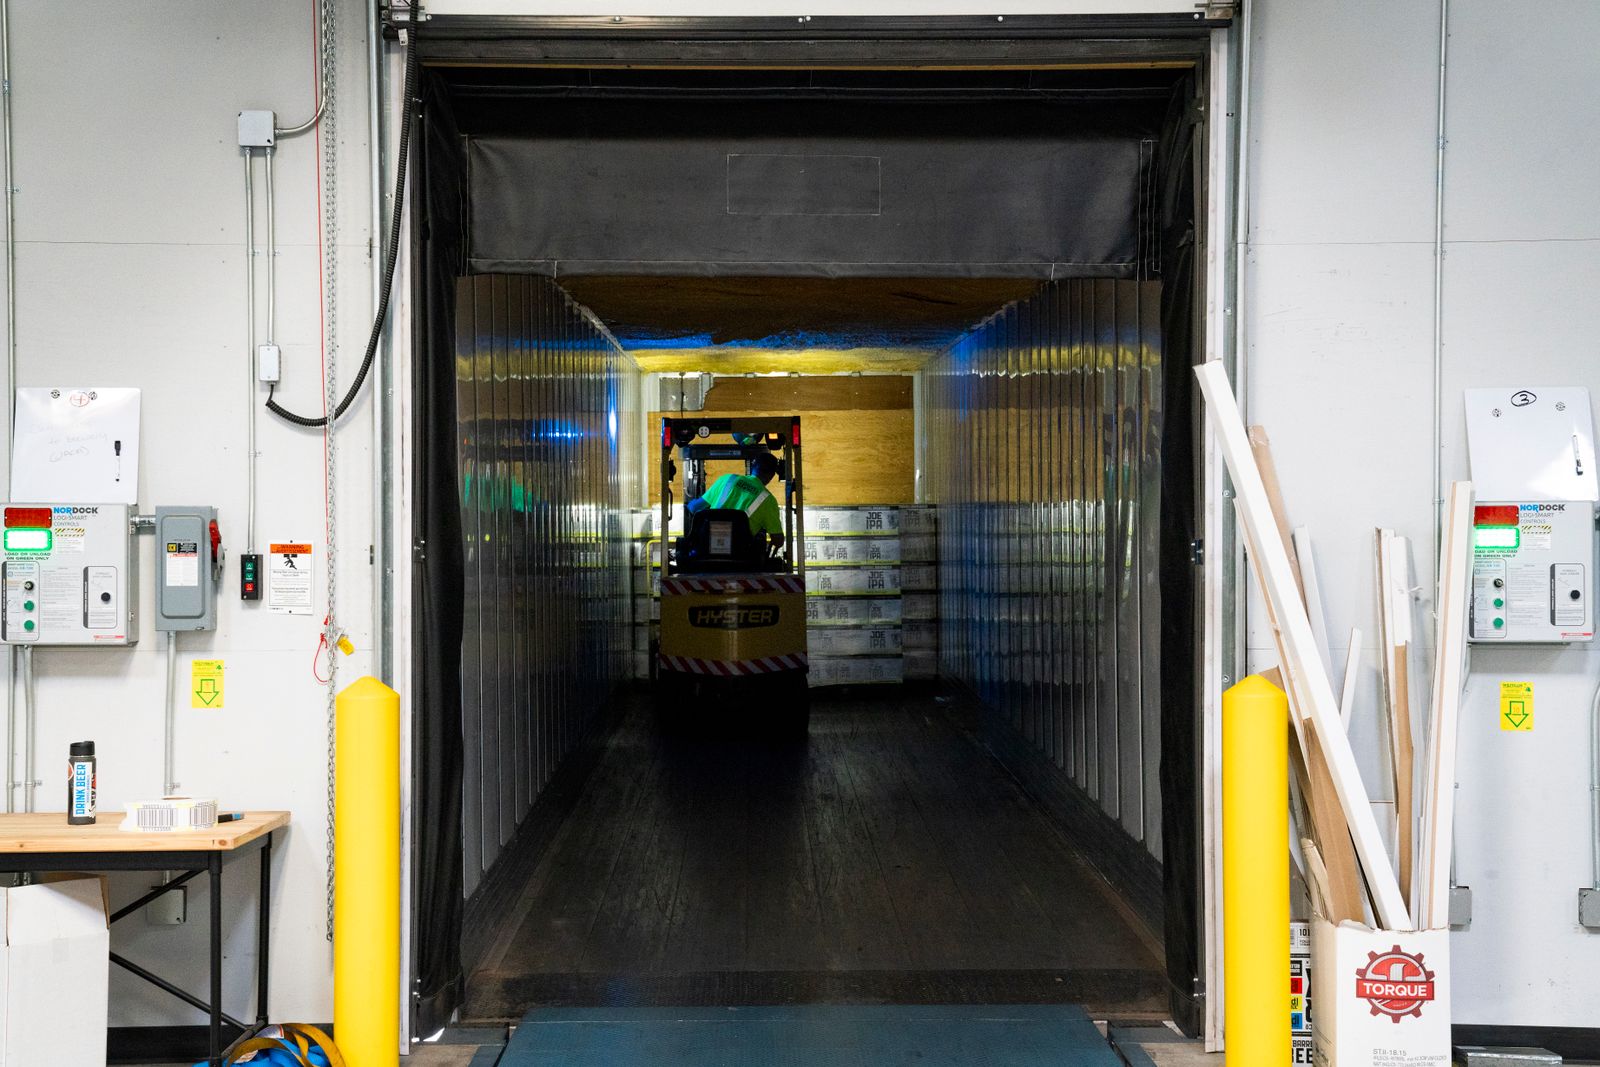
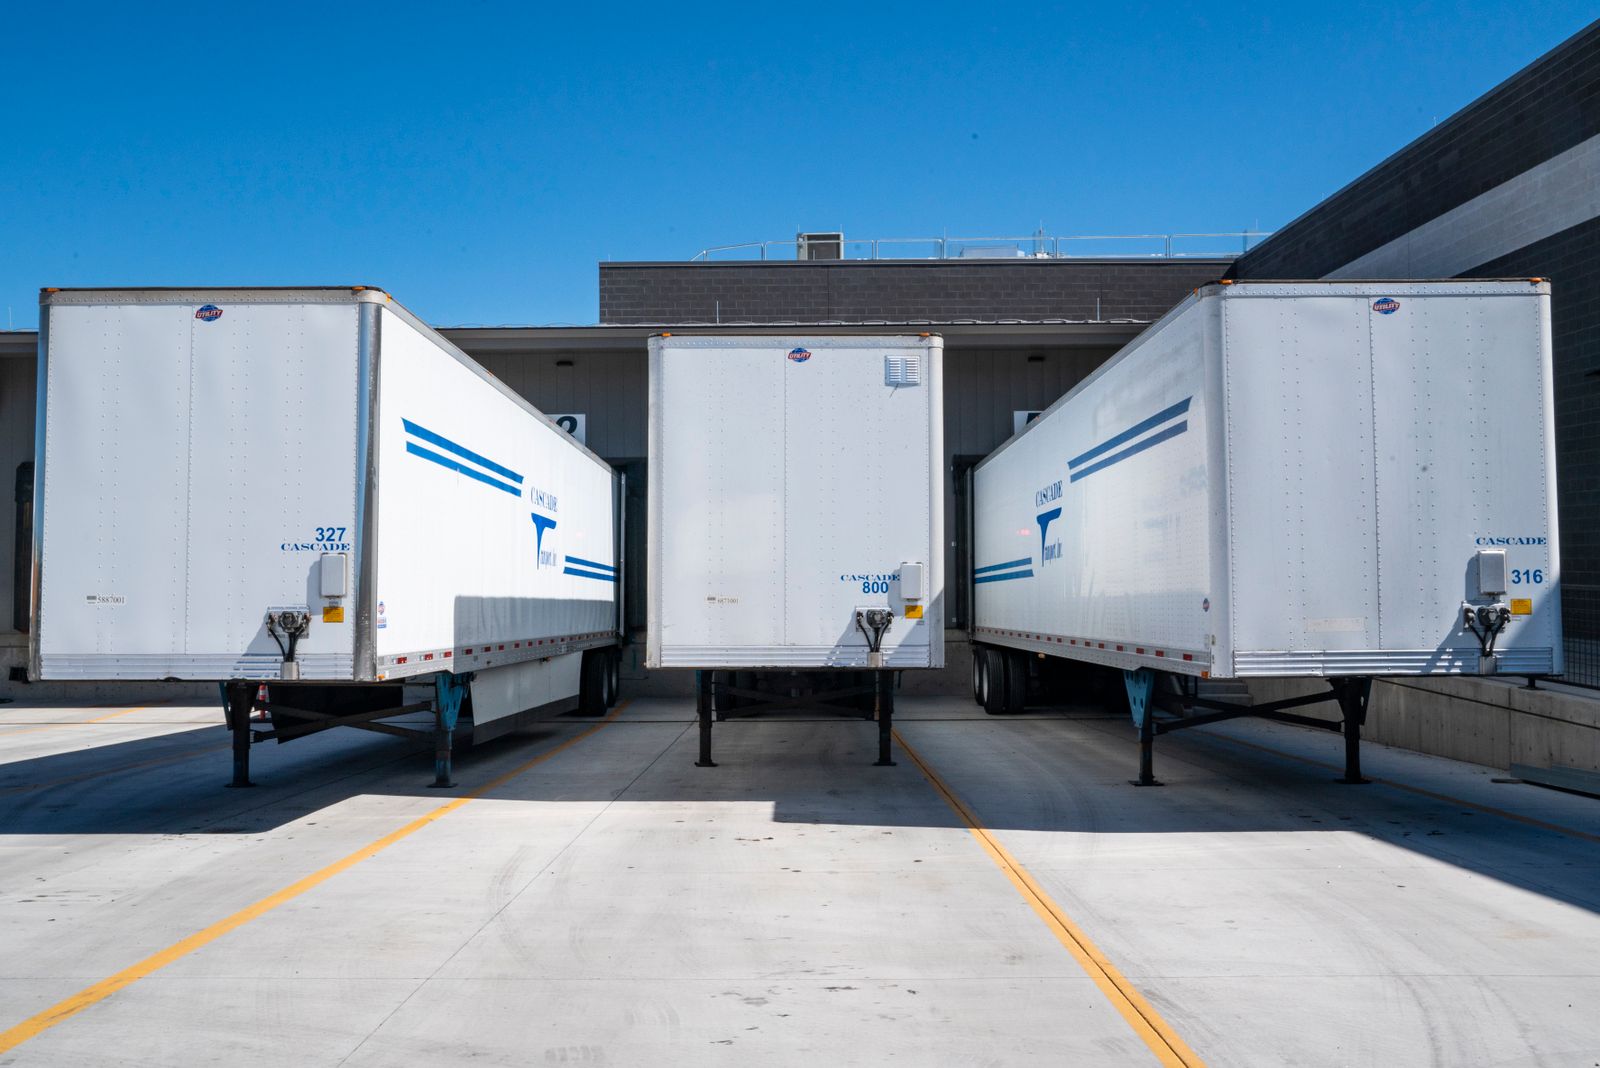

Eagan and Airport South
Endcaps, storefronts and single tenant net lease assets, priced against real Twin Cities comparables.
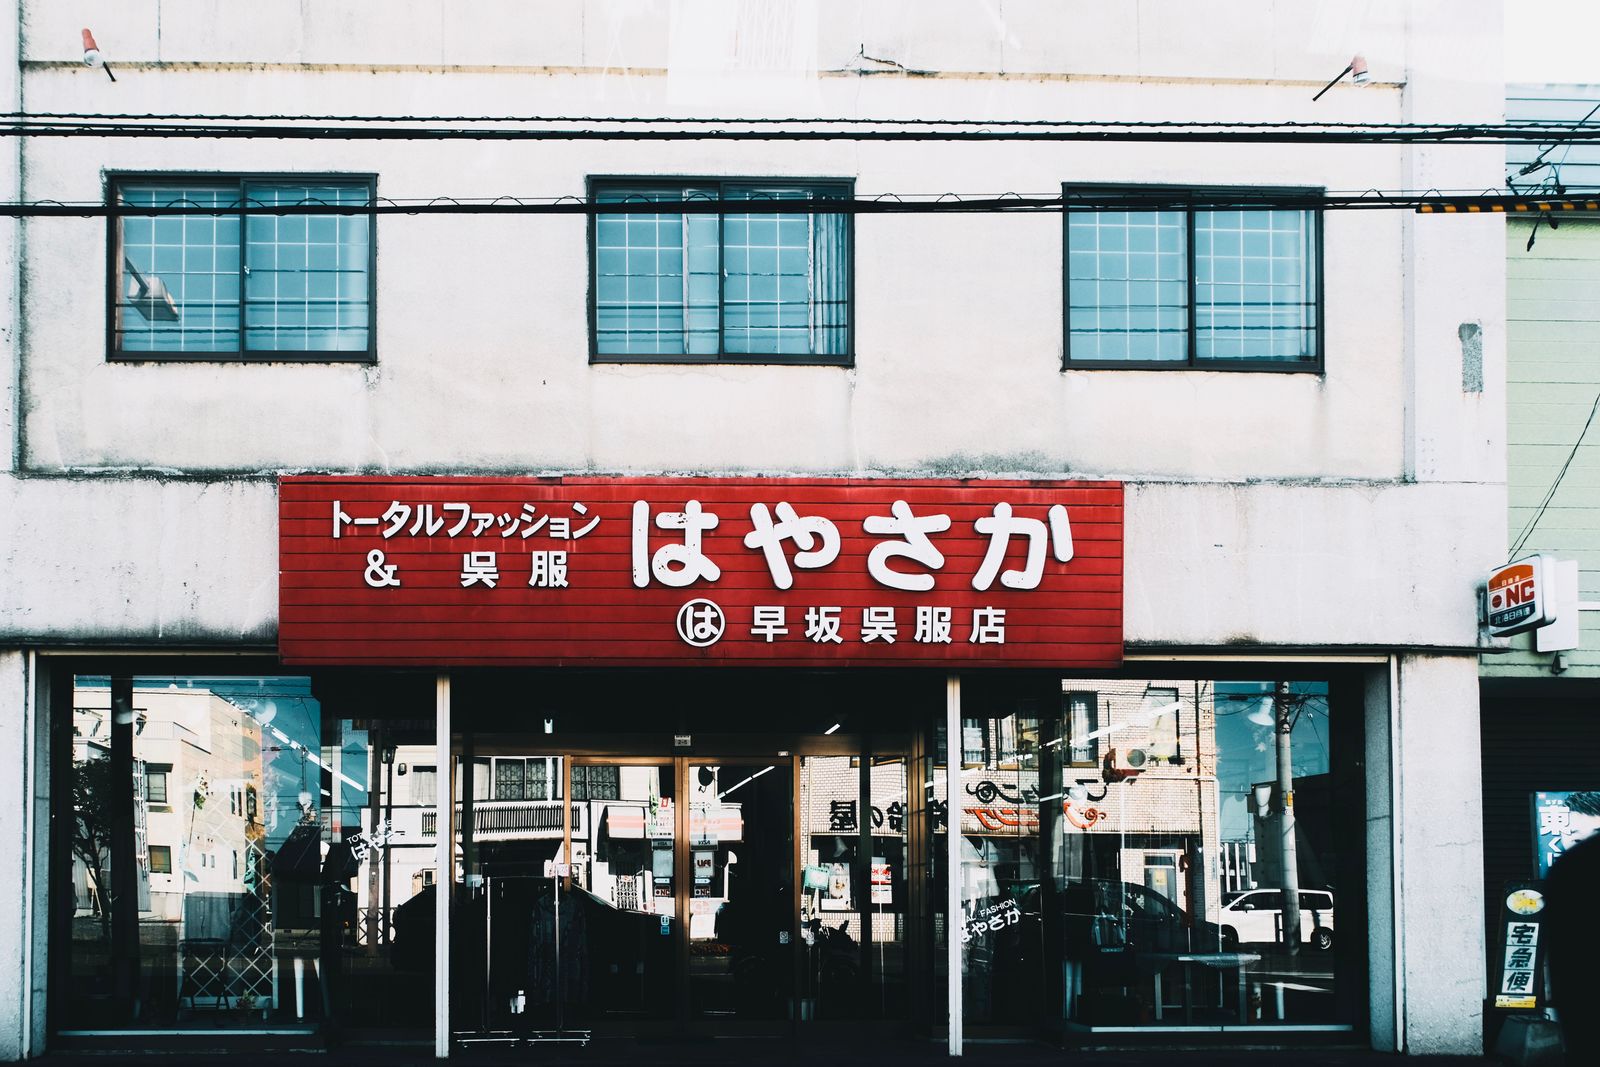
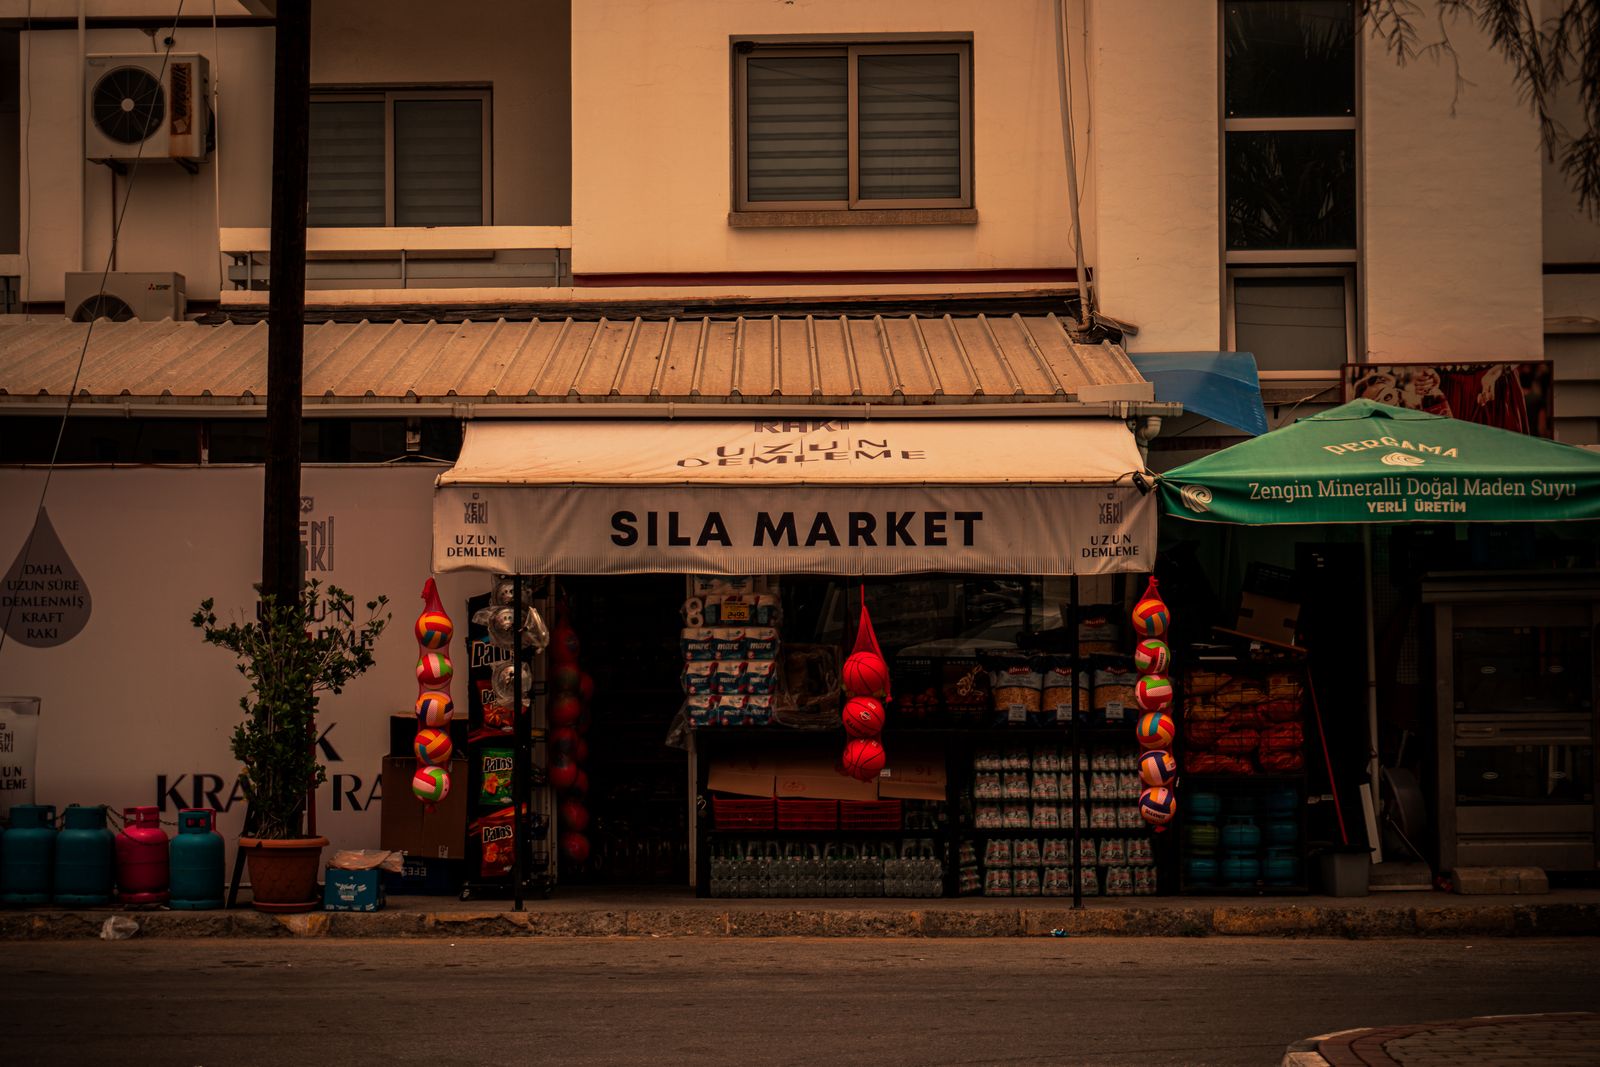
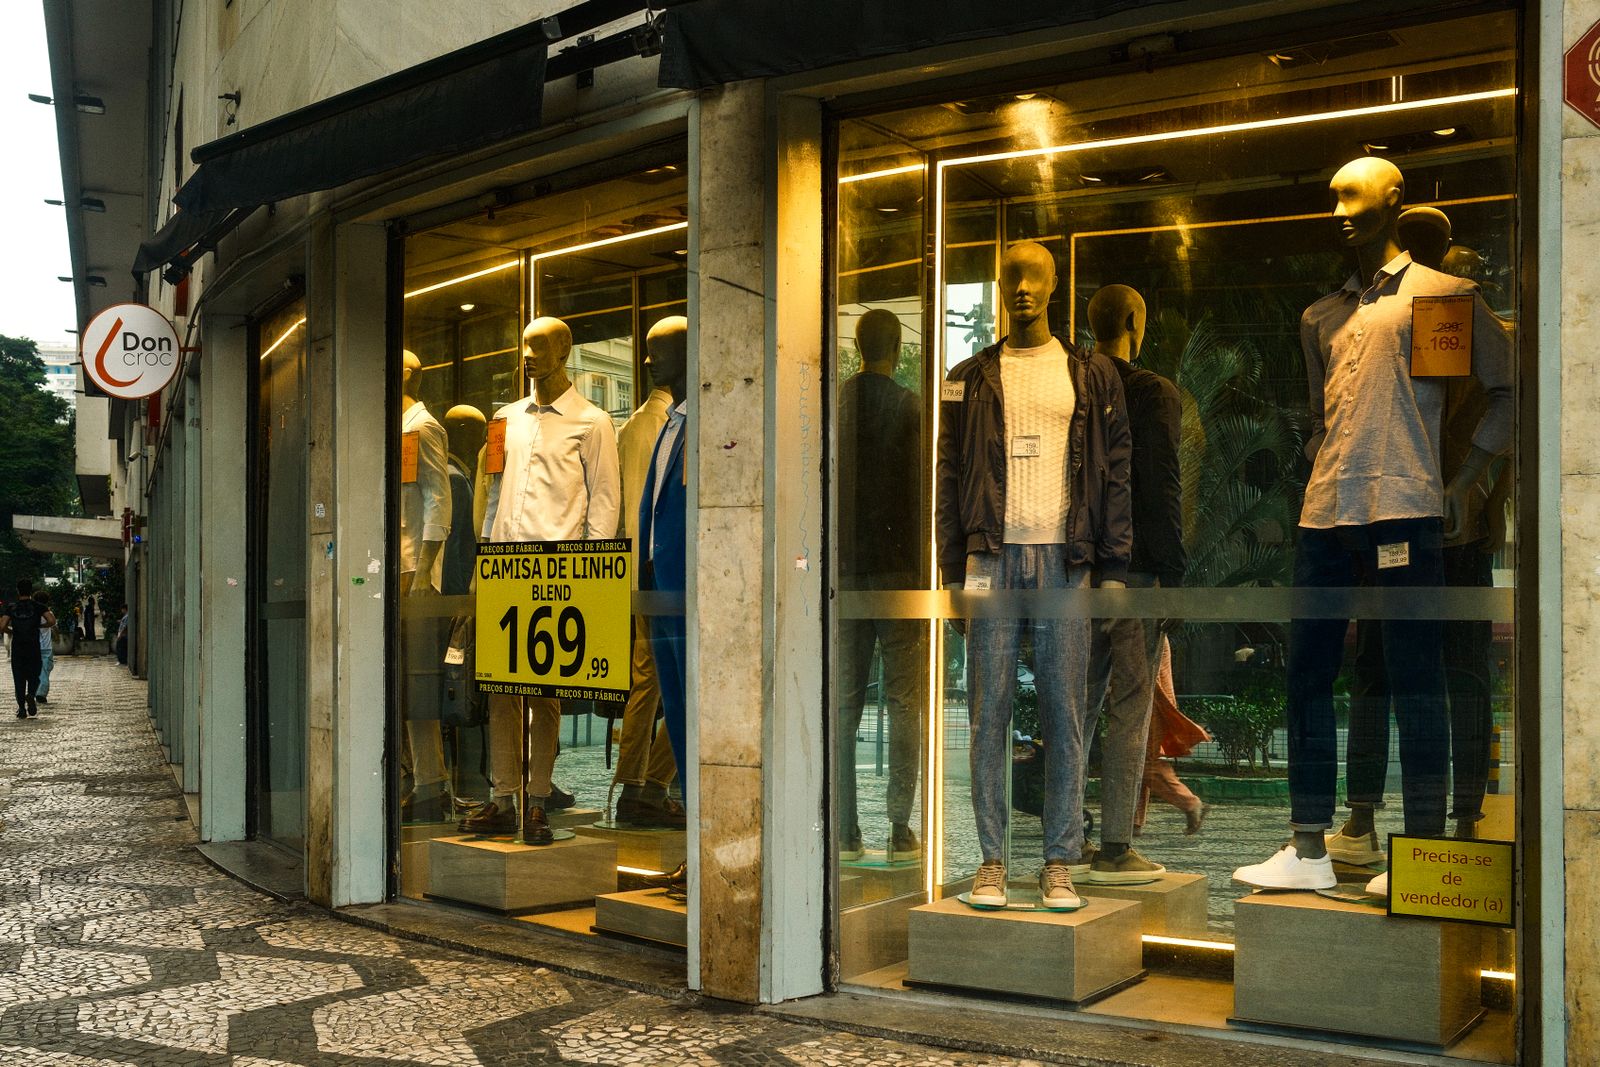
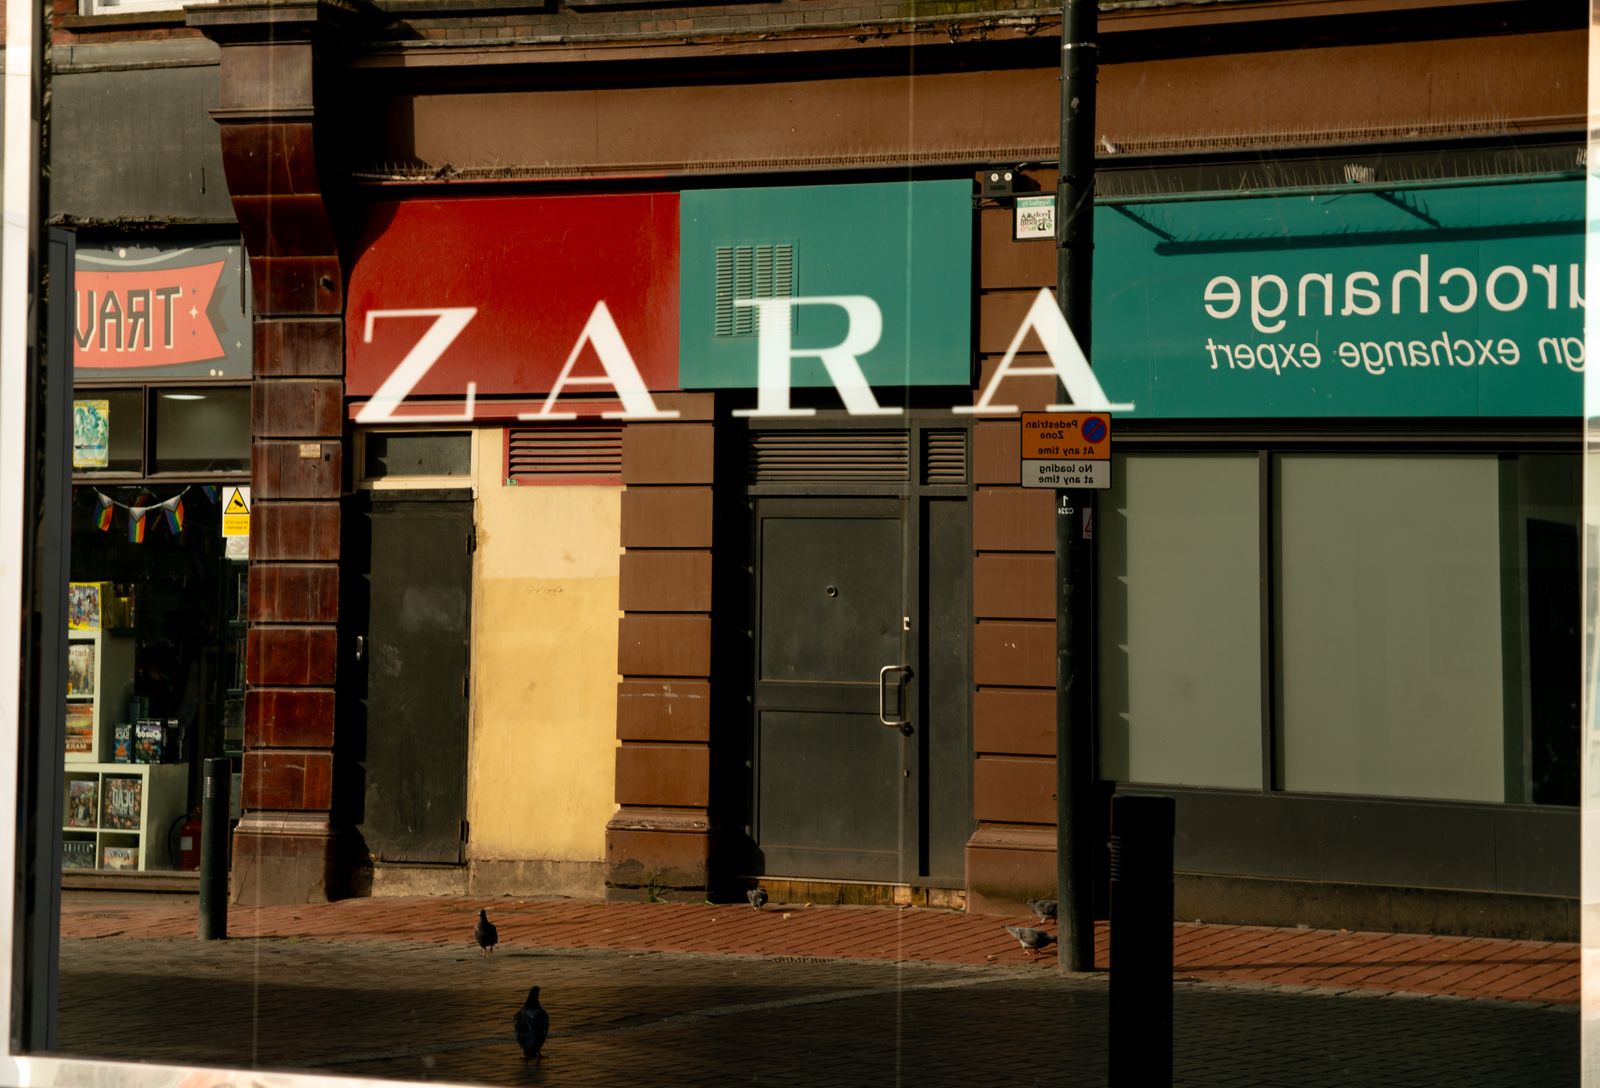

Retail availabilities
Six practices, one brokerage. Occupiers on one side, owners and investors on the other.






Tenant representation
MN Broker Licence #XXXXXXXX (placeholder) · Demonstration site with sample content
Gross occupancy cost runs roughly five to nine dollars under comparable Minneapolis CBD space, and the floor plates are more forgiving.

St. Paul's core is smaller, older and considerably cheaper than Minneapolis. The inventory is dominated by pre-war masonry buildings, many converted in the last twenty years, with floor plates in the 15,000 to 25,000 square foot range and load factors that tend to sit between 1.11 and 1.15.
The value argument is straightforward. A tenant paying 28 dollars gross per rentable square foot in Lowertown would pay 33 to 35 for comparable quality downtown Minneapolis. Over a ten year term on 20,000 square feet that difference is well over a million dollars.
What you give up is the skyway network, which is far less complete than Minneapolis, and a thinner restaurant and amenity base outside the immediate Lowertown blocks. What you gain is Union Depot, the Green Line and a materially shorter commute for anyone living east of the river.
Seven metrics per property type. Sublease availability is listed separately because it competes with direct space on price and the headline vacancy figure hides it.
| Property type | Vacancy | Sublease available | Net absorption | Under construction | Asking rate | Structure | Year on year |
|---|---|---|---|---|---|---|---|
| Office | 19.6% | 410,000 SF | -84,000 SF | 0 SF | $16.20 | NNN | -0.9% |
| Retail | 11.2% | 26,000 SF | +14,000 SF | 0 SF | $22.75 | NNN | +0.6% |
| Industrial | 4.2% | 61,000 SF | +96,000 SF | 120,000 SF | $9.65 | NNN | +5.1% |
Quoted nnn.
Quoted nnn.
Quoted nnn.
Sample Illustrative figures for a demonstration website. Real submarket research is published quarterly and is available on request.
214 East Fourth Street, St. Paul
The largest contiguous block in Lowertown, at a gross occupancy cost roughly nine dollars under comparable Minneapolis CBD space.
Space detail1044 Grand Avenue, St. Paul
A sublease through August 2029 at roughly four dollars under the current direct asking rate on Grand.
Space detail755 Vandalia Street, St. Paul
A 36 month sublease at nearly two dollars under the direct rate, for a user who does not need the height.
Space detail
Tomas Lindgren
Senior Advisor, Retail leasing
Tomas leases retail across the east metro and the western suburbs, with a particular concentration in restaurant and food service requirements where the infrastructure question decides the deal.
We will send the current availability set, the comparable deals we know about and an honest view of what the submarket will actually agree to.
We value your privacy
We use cookies to run this site, remember your preferences and understand how it is used.Cookie policy