023 inputs
Load factor and usable area
How much common area you are renting and what it costs a year.
Open the calculatorTwin Cities office, industrial, retail and investment. Demonstration site with sample content.
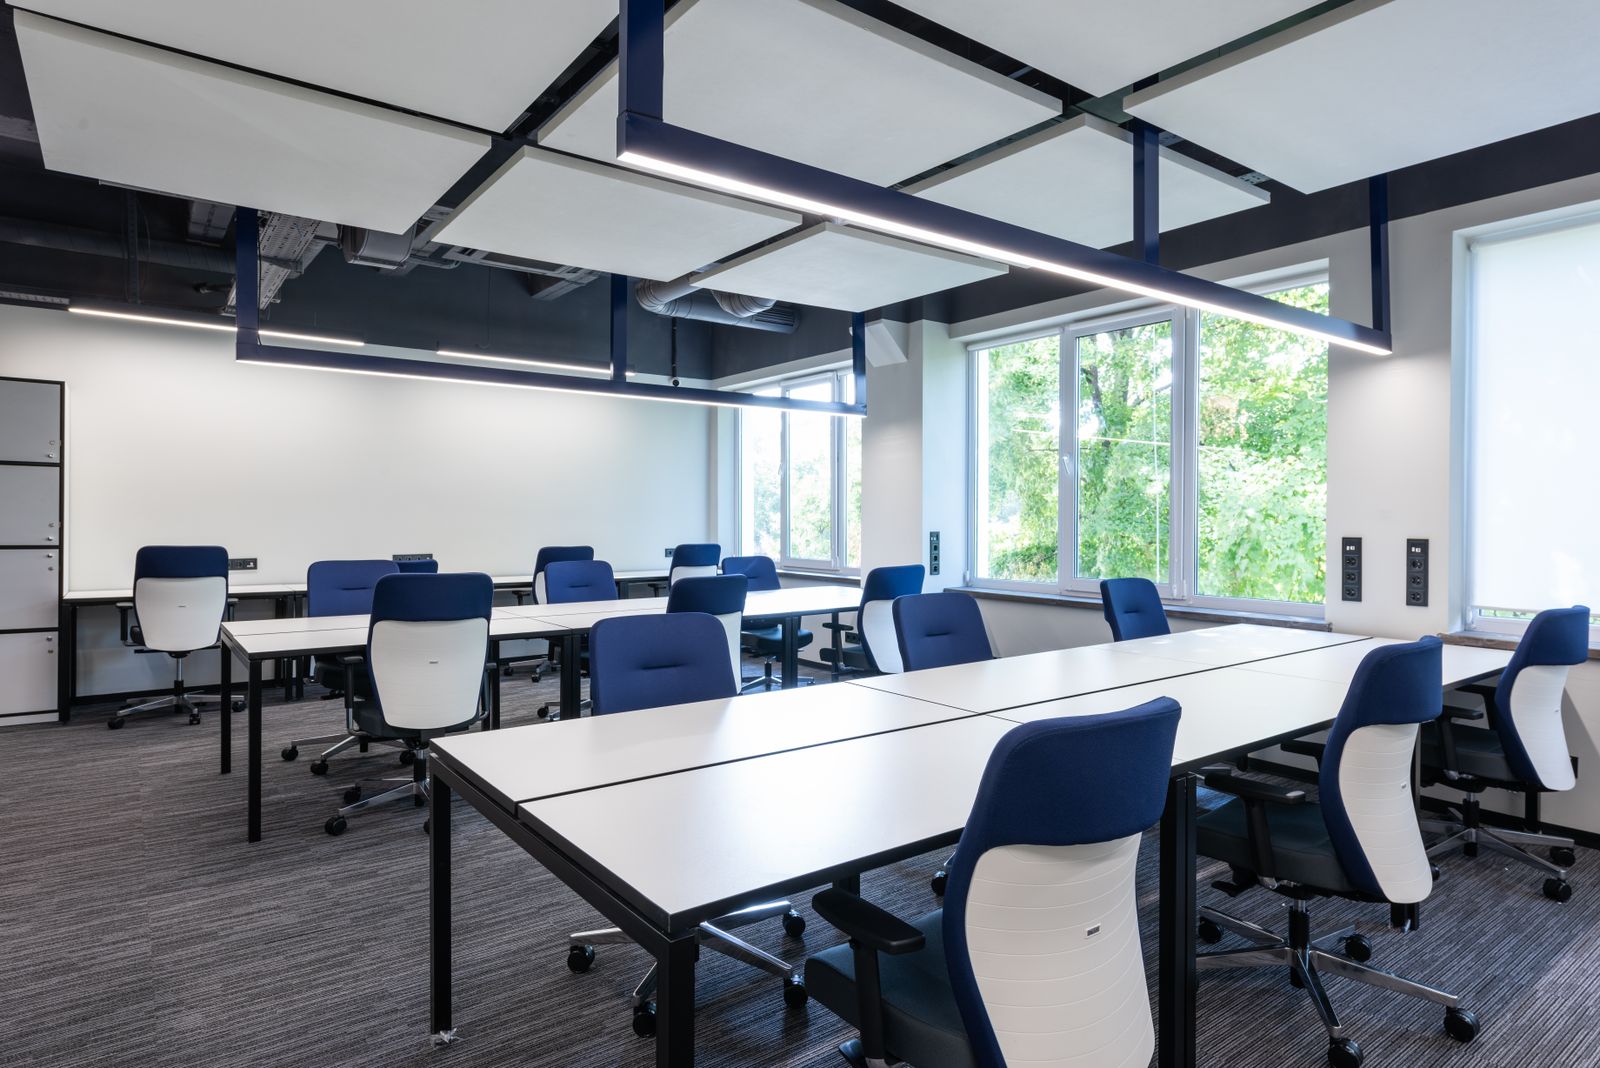
Downtown towers, North Loop creative space and suburban campuses, leased on your side of the table.

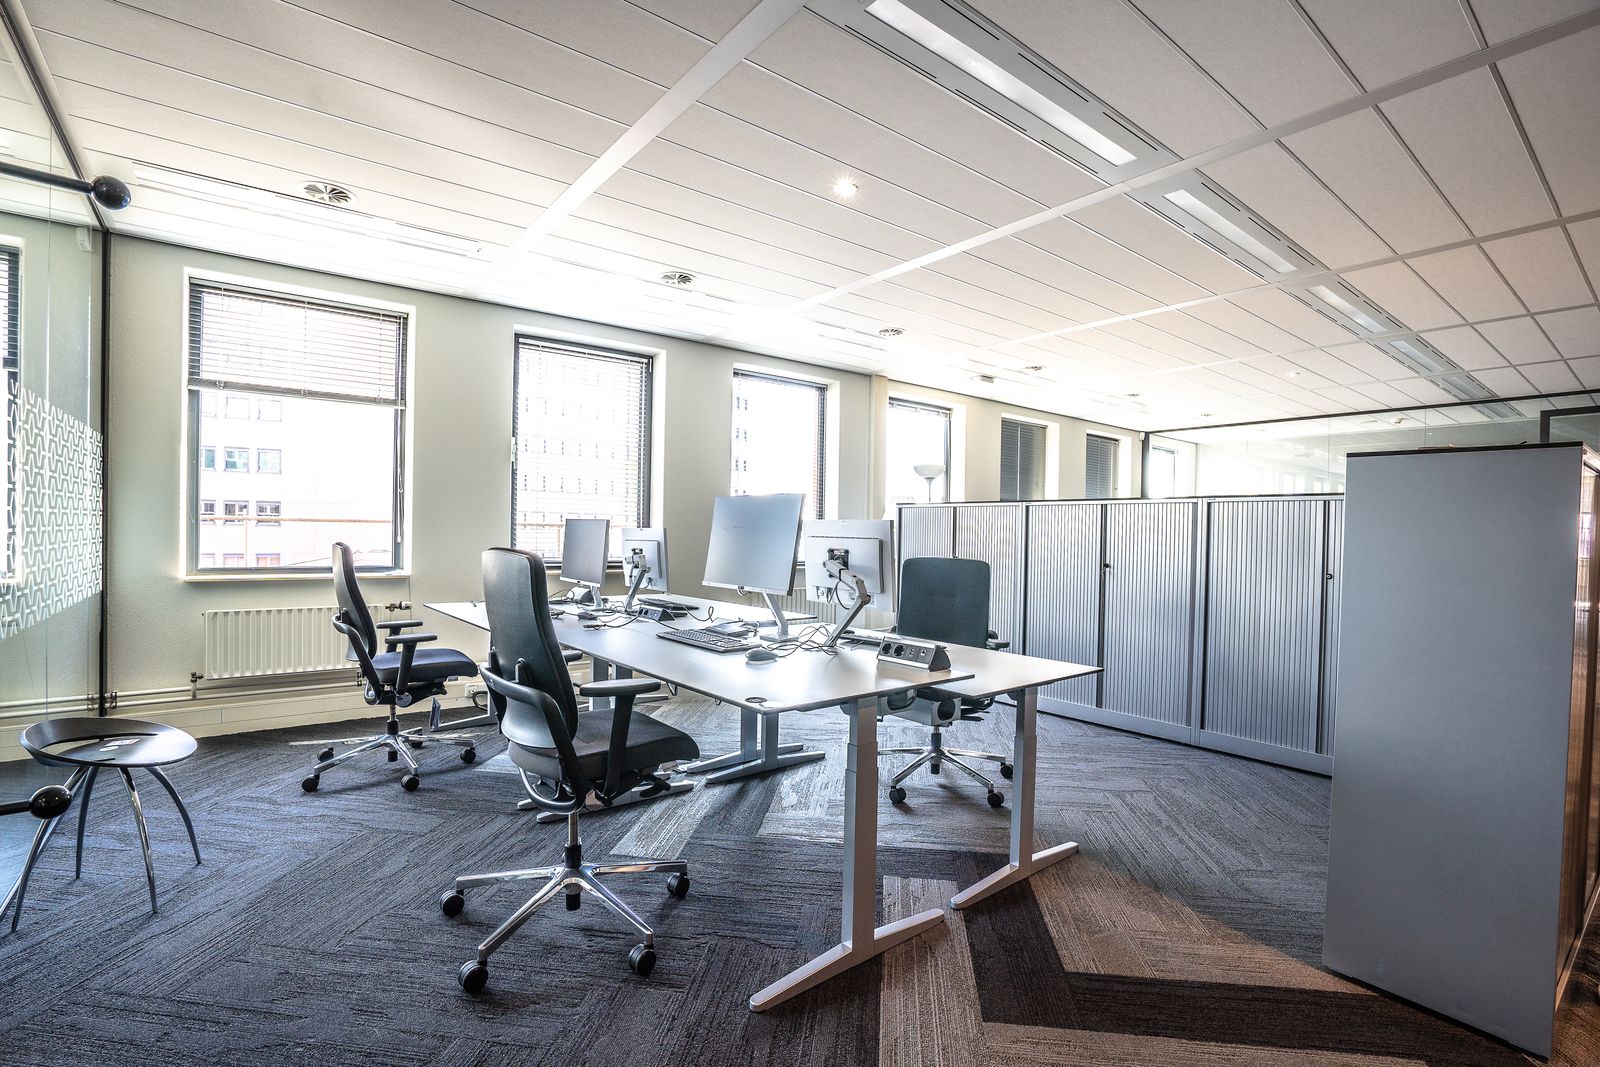

Minneapolis CBD
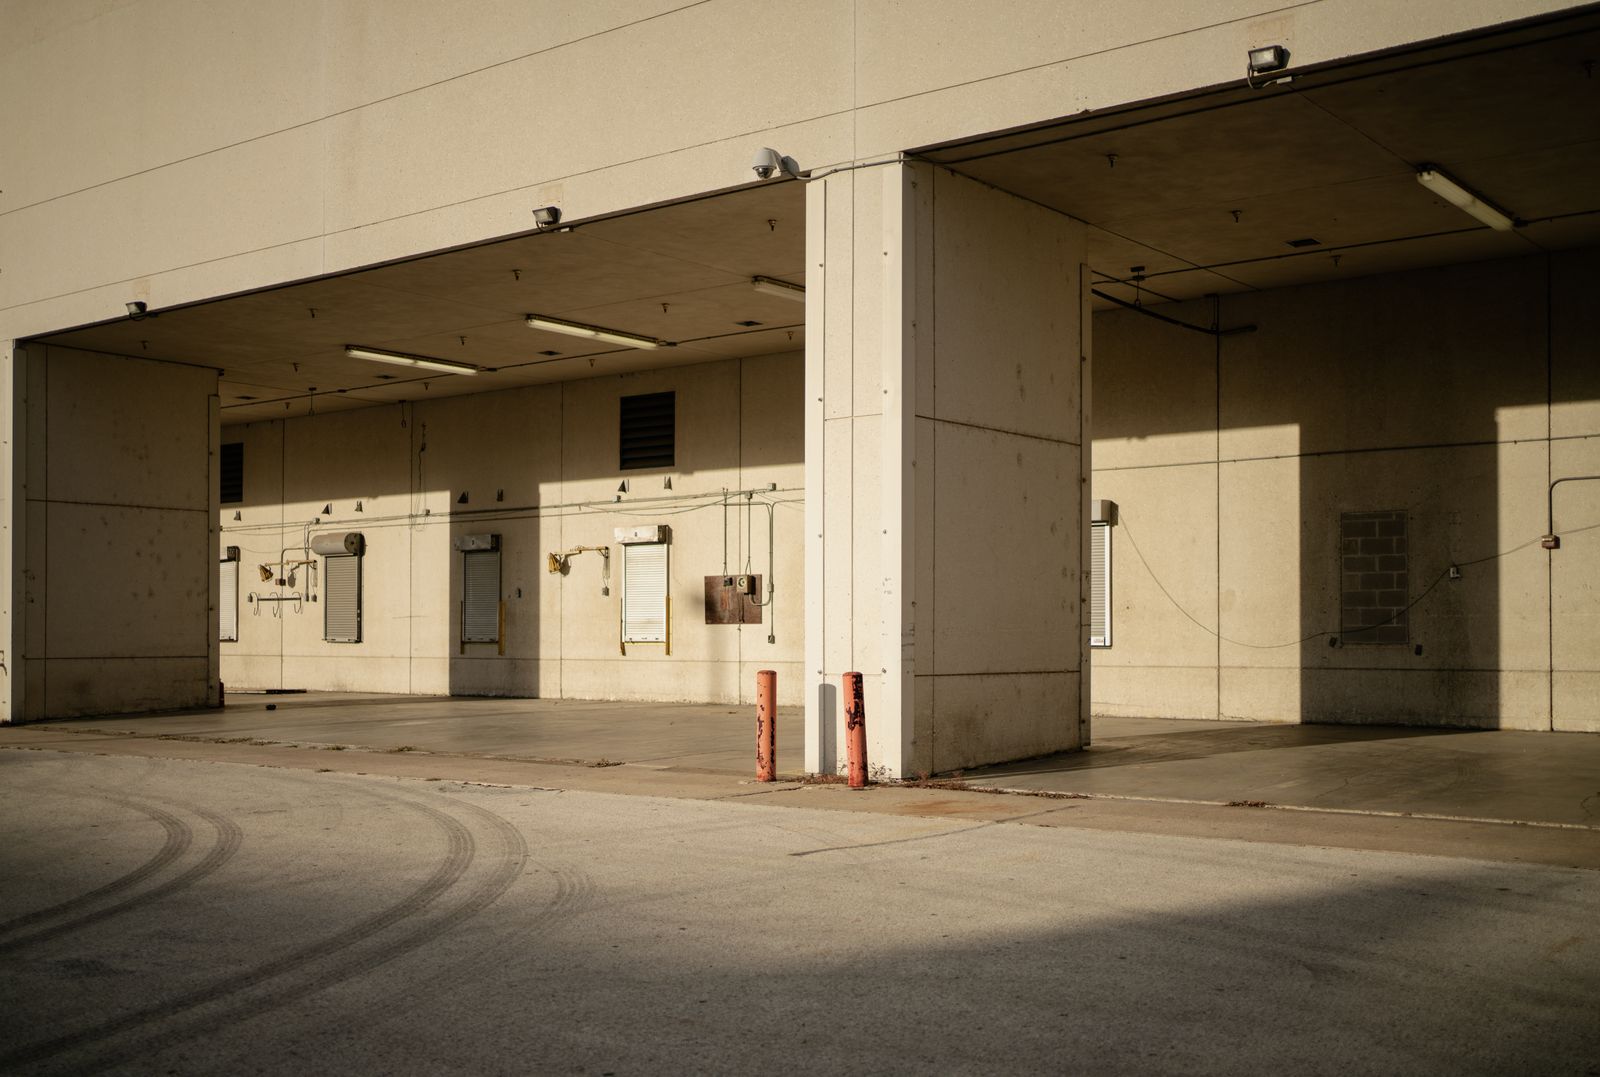
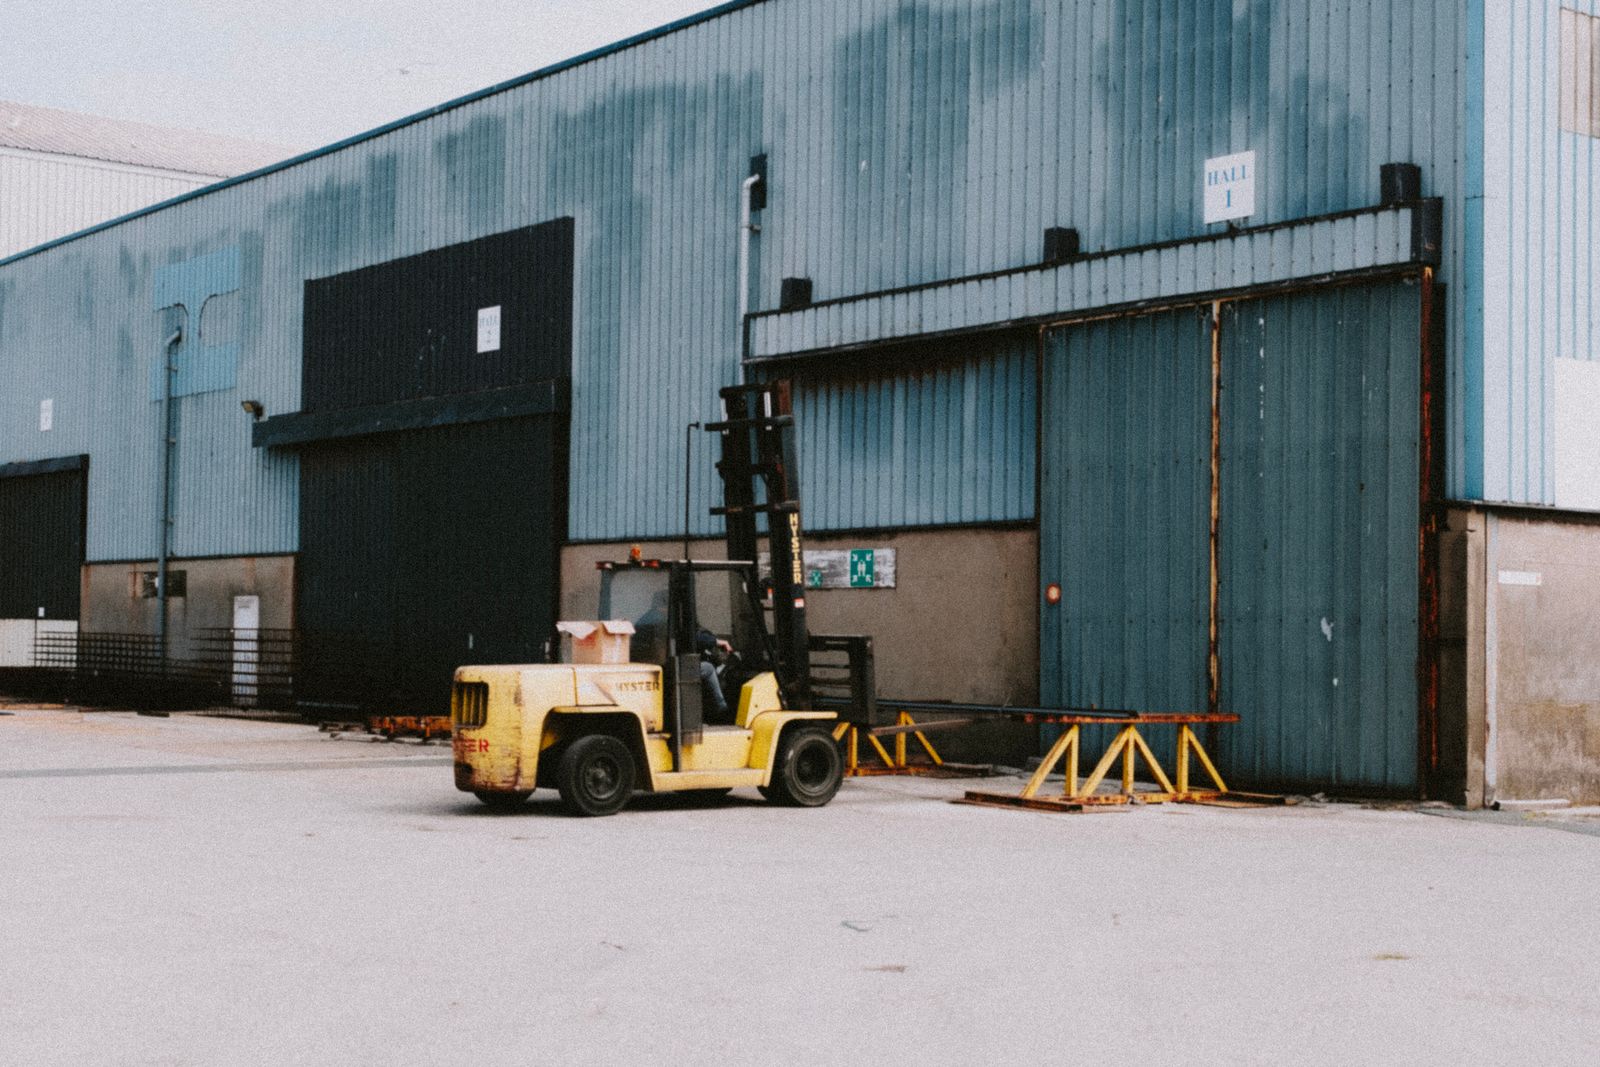
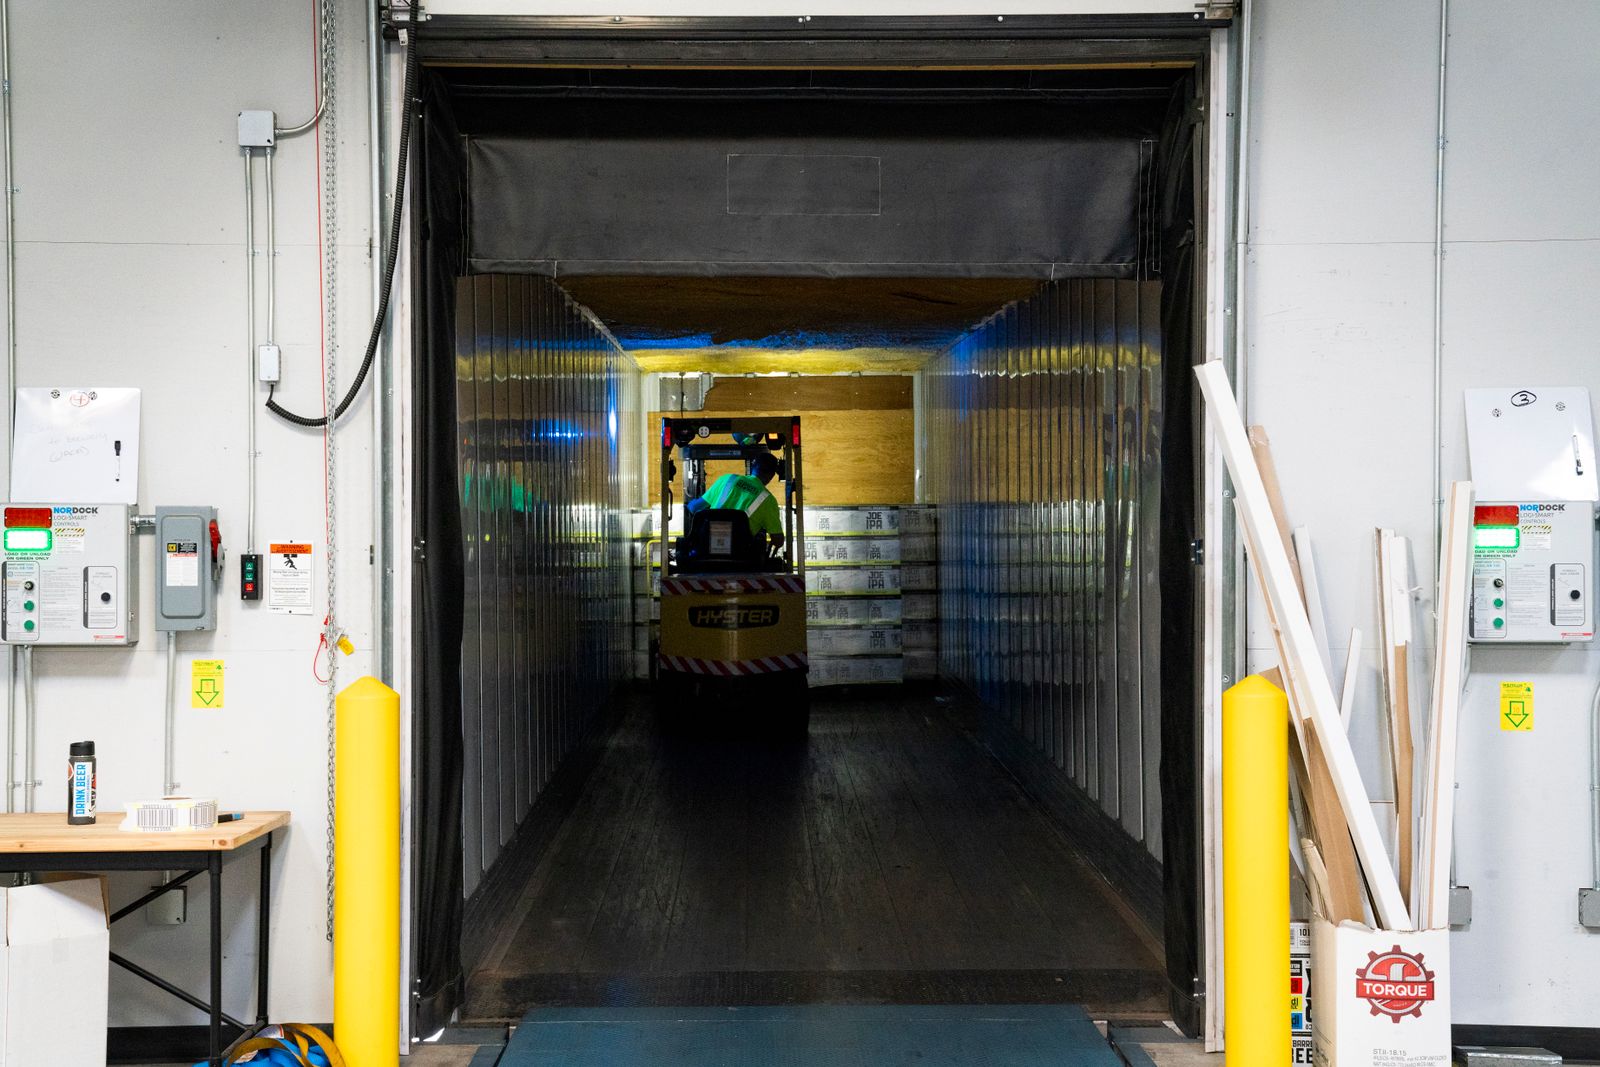
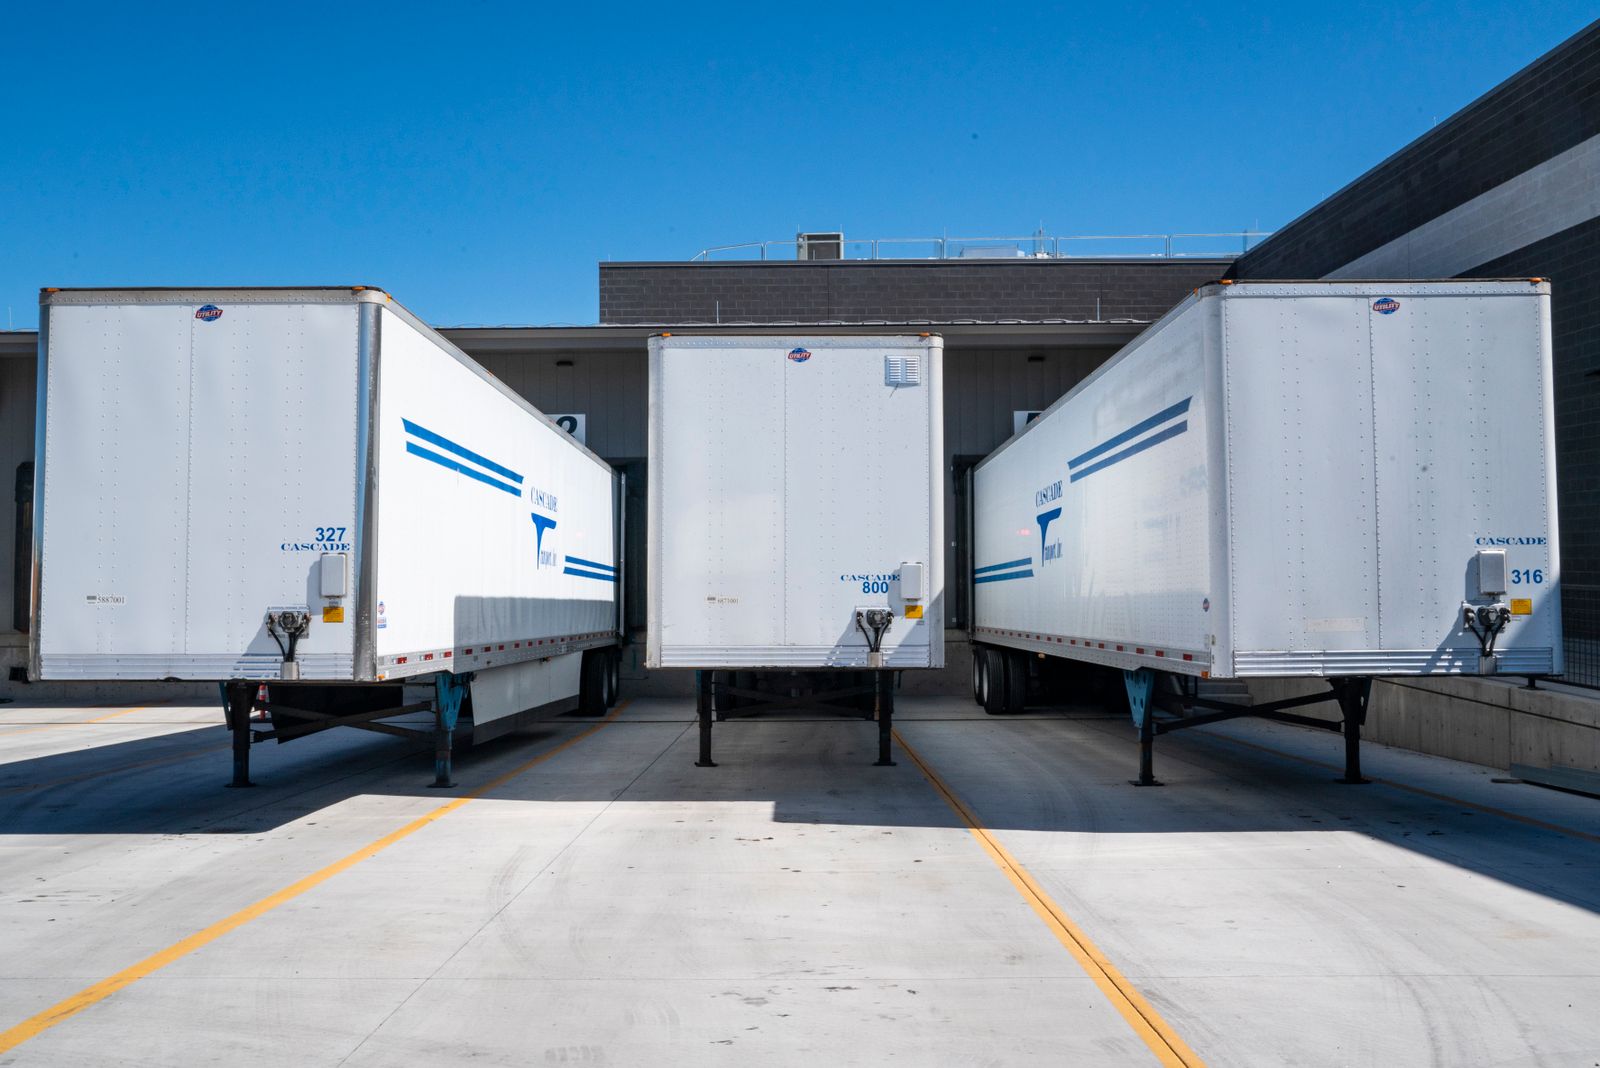
Distribution, light manufacturing and crossdock buildings across the airport south and northwest corridors.
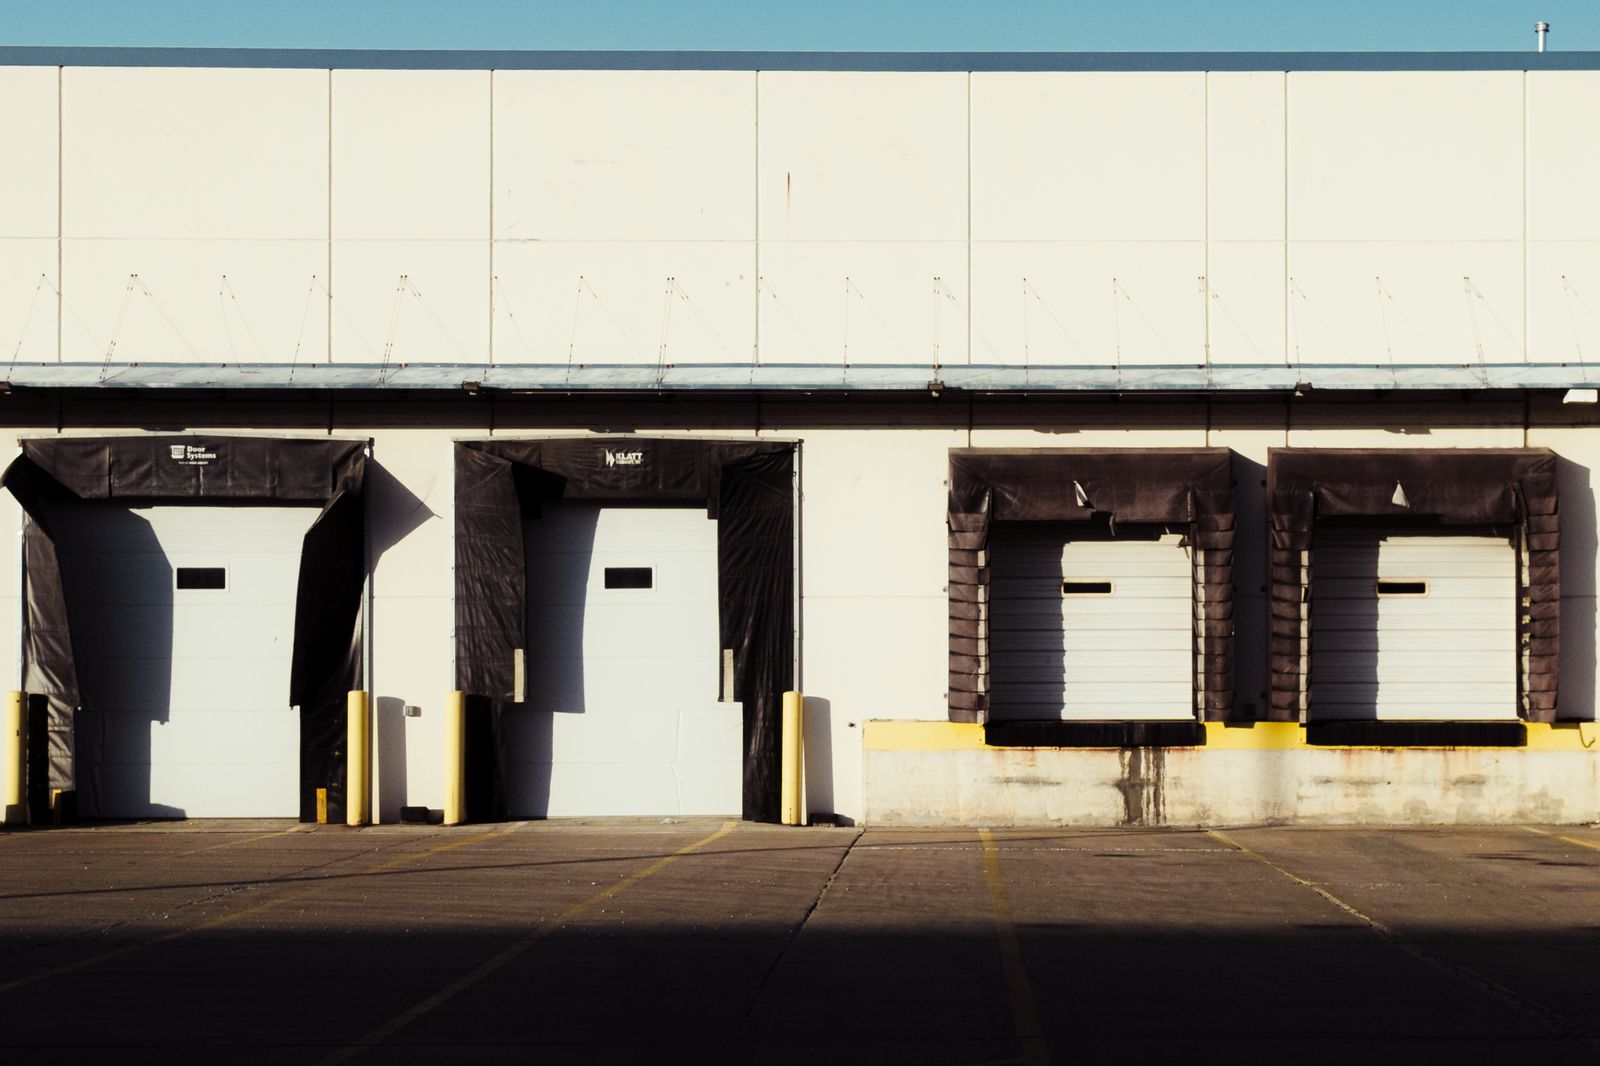

Eagan and Airport South
Endcaps, storefronts and single tenant net lease assets, priced against real Twin Cities comparables.




Retail availabilities
Six practices, one brokerage. Occupiers on one side, owners and investors on the other.






Tenant representation
MN Broker Licence #XXXXXXXX (placeholder) · Demonstration site with sample content
Enter a proposal and this returns the year one cost, the monthly cost, the cost per employee, the net effective rate across the term and the total obligation.

Two real-looking proposals for the same 14,280 square foot requirement. The one with the higher face rate is cheaper over seven years, and it is not close.
| Term | Tower proposal | Loft proposal |
|---|---|---|
| Base rate | $19.50 NNN | $24.00 modified gross |
| Operating expenses | $13.85 per SF | $6.20 per SF |
| Gross year one | $33.35 per SF | $30.20 per SF |
| Load factor | 1.16 | 1.09 |
| Free rent | 6 months | 3 months |
| Improvement allowance | $45 per SF | $20 per SF |
| Annual escalation | 2.75% | 3.00% |
| Net effective rate, 7 years | $14.60 per SF | $19.53 per SF |
| Gross cost per usable SF, year one | $38.69 | $32.92 |
Six months free and a 45 dollar allowance are worth more than the 4.50 difference in face rate.
The 1.09 load factor means you occupy more of what you pay for, and the modified gross structure carries a much lighter expense load.
The tower is cheaper over the term but requires a bigger build-out and gives the concessions back over seven years. The loft costs less every month from day one.
Sample Both proposals are invented for this demonstration website. They are constructed to be realistic, not to describe available space.
Because free rent and the improvement allowance are both money the landlord is giving back. The net effective rate spreads those concessions across every year of the term, which is the only way to compare a proposal at 24.00 with eight months free against one at 21.50 with none.
It should include the real estate taxes, building insurance and common area maintenance your lease passes through, at the landlord's current estimate. Ask for the last two years of actuals as well: an estimate that has been understated for two years is a pass-through waiting to happen. Parking, after hours HVAC and your own electricity usually sit outside it.
Twin Cities office leases commonly carry fixed annual increases in the range of 2.5 to 3.5 percent on base rent, with operating expenses passed through at actual cost. Industrial often runs 3 to 4 percent. Those are sample planning ranges, not a quote.
No. It values the allowance the landlord offers, not what your build-out will cost. If your scope prices above the allowance, the difference is capital you spend on day one and it is not in this model. Get a contractor's budget before the letter of intent, not after.
Between 150 and 250 rentable square feet per employee covers most professional office layouts today, with more enclosed offices pushing toward the top of that range and heavily open plans below it. Law firms and medical practices run considerably higher. Count your real programme rather than a benchmark.
How much common area you are renting and what it costs a year.
Open the calculatorNet operating income, value at a cap rate and loan sizing under both constraints.
Open the calculatorWe will model them on identical assumptions and write down the differences, including the ones that argue against the building we would prefer.
We value your privacy
We use cookies to run this site, remember your preferences and understand how it is used.Cookie policy